<< Chapter < Page Chapter >> Page >
  • Find the center of mass of objects distributed along a line.
  • Locate the center of mass of a thin plate.
  • Use symmetry to help locate the centroid of a thin plate.
  • Apply the theorem of Pappus for volume.

In this section, we consider centers of mass (also called centroids , under certain conditions) and moments. The basic idea of the center of mass is the notion of a balancing point. Many of us have seen performers who spin plates on the ends of sticks. The performers try to keep several of them spinning without allowing any of them to drop. If we look at a single plate (without spinning it), there is a sweet spot on the plate where it balances perfectly on the stick. If we put the stick anywhere other than that sweet spot, the plate does not balance and it falls to the ground. (That is why performers spin the plates; the spin helps keep the plates from falling even if the stick is not exactly in the right place.) Mathematically, that sweet spot is called the center of mass of the plate .

In this section, we first examine these concepts in a one-dimensional context, then expand our development to consider centers of mass of two-dimensional regions and symmetry. Last, we use centroids to find the volume of certain solids by applying the theorem of Pappus.

Center of mass and moments

Let’s begin by looking at the center of mass in a one-dimensional context. Consider a long, thin wire or rod of negligible mass resting on a fulcrum, as shown in [link] (a). Now suppose we place objects having masses m 1 and m 2 at distances d 1 and d 2 from the fulcrum, respectively, as shown in [link] (b).

This figure has two images. The first image is a horizontal line on top of an equilateral triangle. It represents a rod on a fulcrum. The second image is the same as the first with two squares on the line. They are labeled msub1 and msub2. The distance from msub1 to the fulcrum is dsub1. The distance from msub2 to the fulcrum is dsub2.
(a) A thin rod rests on a fulcrum. (b) Masses are placed on the rod.

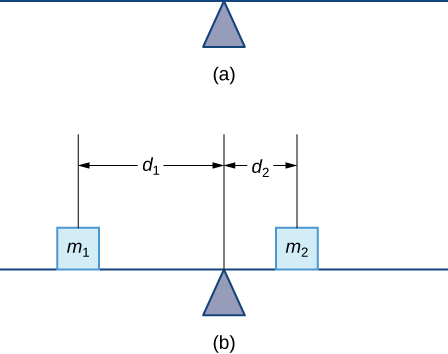
The most common real-life example of a system like this is a playground seesaw, or teeter-totter, with children of different weights sitting at different distances from the center. On a seesaw, if one child sits at each end, the heavier child sinks down and the lighter child is lifted into the air. If the heavier child slides in toward the center, though, the seesaw balances. Applying this concept to the masses on the rod, we note that the masses balance each other if and only if m 1 d 1 = m 2 d 2 .

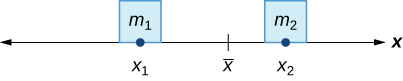
In the seesaw example, we balanced the system by moving the masses (children) with respect to the fulcrum. However, we are really interested in systems in which the masses are not allowed to move, and instead we balance the system by moving the fulcrum. Suppose we have two point masses, m 1 and m 2 , located on a number line at points x 1 and x 2 , respectively ( [link] ). The center of mass, x , is the point where the fulcrum should be placed to make the system balance.

This figure is an image of the x-axis. On the axis there is a point labeled x bar. Also on the axis there is a point xsub1 with a square above it. Inside of the square is the label msub1. There is also a point xsub2 on the axis. Above this point there is a square. Inside of the square is the label msub2.
The center of mass x is the balance point of the system.

Thus, we have

m 1 | x 1 x | = m 2 | x 2 x | m 1 ( x x 1 ) = m 2 ( x 2 x ) m 1 x m 1 x 1 = m 2 x 2 m 2 x x ( m 1 + m 2 ) = m 1 x 1 + m 2 x 2 x = m 1 x 1 + m 2 x 2 m 1 + m 2 .

The expression in the numerator, m 1 x 1 + m 2 x 2 , is called the first moment of the system with respect to the origin. If the context is clear, we often drop the word first and just refer to this expression as the moment    of the system. The expression in the denominator, m 1 + m 2 , is the total mass of the system. Thus, the center of mass    of the system is the point at which the total mass of the system could be concentrated without changing the moment.

Questions & Answers

how do you get the 2/50
Abba Reply
number of sport play by 50 student construct discrete data
Aminu Reply
width of the frangebany leaves on how to write a introduction
Theresa Reply
Solve the mean of variance
Veronica Reply
Step 1: Find the mean. To find the mean, add up all the scores, then divide them by the number of scores. ... Step 2: Find each score's deviation from the mean. ... Step 3: Square each deviation from the mean. ... Step 4: Find the sum of squares. ... Step 5: Divide the sum of squares by n – 1 or N.
kenneth
what is error
Yakuba Reply
Is mistake done to something
Vutshila
Hy
anas
hy
What is the life teble
anas
hy
Jibrin
statistics is the analyzing of data
Tajudeen Reply
what is statics?
Zelalem Reply
how do you calculate mean
Gloria Reply
diveving the sum if all values
Shaynaynay
let A1,A2 and A3 events be independent,show that (A1)^c, (A2)^c and (A3)^c are independent?
Fisaye Reply
what is statistics
Akhisani Reply
data collected all over the world
Shaynaynay
construct a less than and more than table
Imad Reply
The sample of 16 students is taken. The average age in the sample was 22 years with astandard deviation of 6 years. Construct a 95% confidence interval for the age of the population.
Aschalew Reply
Bhartdarshan' is an internet-based travel agency wherein customer can see videos of the cities they plant to visit. The number of hits daily is a normally distributed random variable with a mean of 10,000 and a standard deviation of 2,400 a. what is the probability of getting more than 12,000 hits? b. what is the probability of getting fewer than 9,000 hits?
Akshay Reply
Bhartdarshan'is an internet-based travel agency wherein customer can see videos of the cities they plan to visit. The number of hits daily is a normally distributed random variable with a mean of 10,000 and a standard deviation of 2,400. a. What is the probability of getting more than 12,000 hits
Akshay
1
Bright
Sorry i want to learn more about this question
Bright
Someone help
Bright
a= 0.20233 b=0.3384
Sufiyan
a
Shaynaynay
How do I interpret level of significance?
Mohd Reply
It depends on your business problem or in Machine Learning you could use ROC- AUC cruve to decide the threshold value
Shivam
how skewness and kurtosis are used in statistics
Owen Reply
yes what is it
Taneeya
Got questions? Join the online conversation and get instant answers!
Jobilize.com Reply
Practice Key Terms 6

Get Jobilize Job Search Mobile App in your pocket Now!

Get it on Google Play Download on the App Store Now


Source:  OpenStax, Calculus volume 1. OpenStax CNX. Feb 05, 2016 Download for free at http://cnx.org/content/col11964/1.2
Google Play and the Google Play logo are trademarks of Google Inc.

Notification Switch

Would you like to follow the 'Calculus volume 1' conversation and receive update notifications?

Ask