<< Chapter < Page Chapter >> Page >
  • Identify the form of an exponential function.
  • Explain the difference between the graphs of x b and b x .
  • Recognize the significance of the number e .
  • Identify the form of a logarithmic function.
  • Explain the relationship between exponential and logarithmic functions.
  • Describe how to calculate a logarithm to a different base.
  • Identify the hyperbolic functions, their graphs, and basic identities.

In this section we examine exponential and logarithmic functions. We use the properties of these functions to solve equations involving exponential or logarithmic terms, and we study the meaning and importance of the number e . We also define hyperbolic and inverse hyperbolic functions, which involve combinations of exponential and logarithmic functions. (Note that we present alternative definitions of exponential and logarithmic functions in the chapter Applications of Integrations , and prove that the functions have the same properties with either definition.)

Exponential functions

Exponential functions arise in many applications. One common example is population growth .

For example, if a population starts with P 0 individuals and then grows at an annual rate of 2 % , its population after 1 year is

P ( 1 ) = P 0 + 0.02 P 0 = P 0 ( 1 + 0.02 ) = P 0 ( 1.02 ) .

Its population after 2 years is

P ( 2 ) = P ( 1 ) + 0.02 P ( 1 ) = P ( 1 ) ( 1.02 ) = P 0 ( 1.02 ) 2 .

In general, its population after t years is

P ( t ) = P 0 ( 1.02 ) t ,

which is an exponential function. More generally, any function of the form f ( x ) = b x , where b > 0 , b 1 , is an exponential function with base     b and exponent     x . Exponential functions have constant bases and variable exponents. Note that a function of the form f ( x ) = x b for some constant b is not an exponential function but a power function.

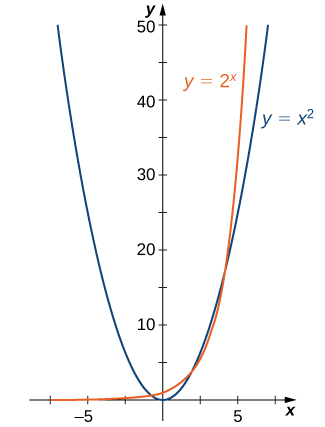
To see the difference between an exponential function and a power function, we compare the functions y = x 2 and y = 2 x . In [link] , we see that both 2 x and x 2 approach infinity as x . Eventually, however, 2 x becomes larger than x 2 and grows more rapidly as x . In the opposite direction, as x , x 2 , whereas 2 x 0 . The line y = 0 is a horizontal asymptote for y = 2 x .

Values of x 2 And 2 x
x −3 −2 −1 0 1 2 3 4 5 6
x 2 9 4 1 0 1 4 9 16 25 36
2 x 1 / 8 1 / 4 1 / 2 1 2 4 8 16 32 64

In [link] , we graph both y = x 2 and y = 2 x to show how the graphs differ.

An image of a graph. The x axis runs from -10 to 10 and the y axis runs from 0 to 50. The graph is of two functions. The first function is “y = x squared”, which is a parabola. The function decreases until it hits the origin and then begins increasing. The second function is “y = 2 to the power of x”, which starts slightly above the x axis, and begins increasing very rapidly, more rapidly than the first function.
Both 2 x and x 2 approach infinity as x , but 2 x grows more rapidly than x 2 . As x , x 2 , whereas 2 x 0 .

Evaluating exponential functions

Recall the properties of exponents: If x is a positive integer, then we define b x = b · b b (with x factors of b ) . If x is a negative integer, then x = y for some positive integer y , and we define b x = b y = 1 / b y . Also, b 0 is defined to be 1 . If x is a rational number, then x = p / q , where p and q are integers and b x = b p / q = b p q . For example, 9 3 / 2 = 9 3 = 27 . However, how is b x defined if x is an irrational number? For example, what do we mean by 2 2 ? This is too complex a question for us to answer fully right now; however, we can make an approximation. In [link] , we list some rational numbers approaching 2 , and the values of 2 x for each rational number x are presented as well. We claim that if we choose rational numbers x getting closer and closer to 2 , the values of 2 x get closer and closer to some number L . We define that number L to be 2 2 .

Questions & Answers

how do you get the 2/50
Abba Reply
number of sport play by 50 student construct discrete data
Aminu Reply
width of the frangebany leaves on how to write a introduction
Theresa Reply
Solve the mean of variance
Veronica Reply
Step 1: Find the mean. To find the mean, add up all the scores, then divide them by the number of scores. ... Step 2: Find each score's deviation from the mean. ... Step 3: Square each deviation from the mean. ... Step 4: Find the sum of squares. ... Step 5: Divide the sum of squares by n – 1 or N.
kenneth
what is error
Yakuba Reply
Is mistake done to something
Vutshila
Hy
anas
hy
What is the life teble
anas
hy
Jibrin
statistics is the analyzing of data
Tajudeen Reply
what is statics?
Zelalem Reply
how do you calculate mean
Gloria Reply
diveving the sum if all values
Shaynaynay
let A1,A2 and A3 events be independent,show that (A1)^c, (A2)^c and (A3)^c are independent?
Fisaye Reply
what is statistics
Akhisani Reply
data collected all over the world
Shaynaynay
construct a less than and more than table
Imad Reply
The sample of 16 students is taken. The average age in the sample was 22 years with astandard deviation of 6 years. Construct a 95% confidence interval for the age of the population.
Aschalew Reply
Bhartdarshan' is an internet-based travel agency wherein customer can see videos of the cities they plant to visit. The number of hits daily is a normally distributed random variable with a mean of 10,000 and a standard deviation of 2,400 a. what is the probability of getting more than 12,000 hits? b. what is the probability of getting fewer than 9,000 hits?
Akshay Reply
Bhartdarshan'is an internet-based travel agency wherein customer can see videos of the cities they plan to visit. The number of hits daily is a normally distributed random variable with a mean of 10,000 and a standard deviation of 2,400. a. What is the probability of getting more than 12,000 hits
Akshay
1
Bright
Sorry i want to learn more about this question
Bright
Someone help
Bright
a= 0.20233 b=0.3384
Sufiyan
a
Shaynaynay
How do I interpret level of significance?
Mohd Reply
It depends on your business problem or in Machine Learning you could use ROC- AUC cruve to decide the threshold value
Shivam
how skewness and kurtosis are used in statistics
Owen Reply
yes what is it
Taneeya
Got questions? Join the online conversation and get instant answers!
Jobilize.com Reply
Practice Key Terms 7

Get Jobilize Job Search Mobile App in your pocket Now!

Get it on Google Play Download on the App Store Now


Source:  OpenStax, Calculus volume 1. OpenStax CNX. Feb 05, 2016 Download for free at http://cnx.org/content/col11964/1.2
Google Play and the Google Play logo are trademarks of Google Inc.

Notification Switch

Would you like to follow the 'Calculus volume 1' conversation and receive update notifications?

Ask