

| << Chapter < Page | Chapter >> Page > |
To conduct your breakeven analysis, take your fixed costs, divided by your price minus your variable costs. As an equation, this is defined as:
Breakeven Point = Fixed Costs/(Unit Selling Price - Variable Costs)
This calculation will let you know how many units of a product you will need to sell to break even. Once you have reached that point, you have recovered all costs associated with producing your product (both variable and fixed).
Above the breakeven point, every additional unit sold increases profit by the amount of the unit contribution margin, which is defined as the amount each unit contributes to covering fixed costs and increasing profits. As an equation, this is defined as:
Unit Contribution Margin = Sales Price - Variable Costs
Recording this information in a spreadsheet will allow you to easily make adjustments as costs change over time, as well as play with different price options and easily calculate the resulting breakeven point. You could use a program such as Excel’s Goal Seek, if you wanted to give yourself a goal of a certain profit, say USD 1 million, and then work backwards to see how many units you would need to sell to hit that number. (This online tutorial will show you how to use Goal Seek.)( [link] ).
There are many types of analyses that managers prepare in order to gain a deeper insight into the operations of their businesses. One of the most important of these is profitability analyses. Managers, know, intuitively, that some customers are more profitable than others, that they make more gross margins on some products than others, and if the business has more than just local coverage, that some geographical regions are more profitable than others. While it is good to know such things intuitively, it is better to know them for sure. And knowing them for sure requires that systematic analyses be prepared.
According to Wikipedia,
“Customer profitability (CP) is the difference between the revenues earned from and the costs associated with the customer relationship in a specified period”.
“Although CP is nothing more than the result of applying the business concept of profit to a customer relationship, measuring the profitability of a firm’s customers or customer groups can often deliver useful business insights.
“Quite often a very small percentage of the firm’s best customers will account for a large portion of firm profit. Although this is a natural consequence of variability in profitability across customers, firms benefit from knowing exactly who the best customers are and how much they contribute to firm profit.
“At the other end of the distribution, firms sometimes find that their worst customers actually cost more to serve than the revenue they deliver. These unprofitable customers actually detract from overall firm profitability. The firm would be better off if they had never acquired these customers in the first place” ( [link] ).
The biggest challenge in measuring customer profitability is the assignment of costs to customers. While it is usually clear what revenue each customer generated, it is often not clear at all what costs the firm incurred serving each customer.So, accountants try and develop some sort of reasonable method of allocating fixed and variable costs to customers. A typical method is to analyze each cost and try to determine the proportion attributable to each customer. A simple and clear-cut example is a situation where a store has both walk-in and on-line customers. The costs of renting and maintaining the physical store could reasonably be allocated to the customers who purchase goods in person, based on the number of visits or more likely on the amount of sales to each customer. On-line customers could have the costs of developing and maintaining the website allocated to them. With this information in hand, a customer profitability analysis can be prepared. It is usually prepared in descending order by customer profitability, as illustrated in [link] :
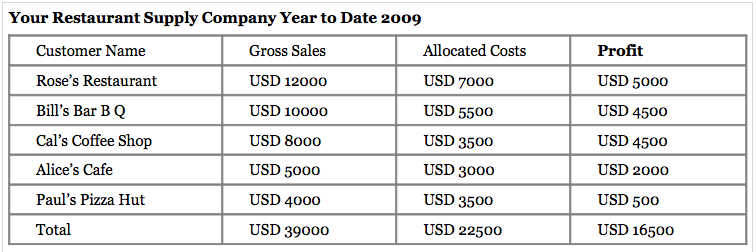
Assume you are the owner of the restaurant supply company illustrated in the exhibit. What kinds of useful information can you gather from an analysis such as this?
Many companies prepare a similar type of analysis at the gross margin level and skip the step of trying to allocate costs to individual customers. In this case, cost of goods sold is substituted for “allocated costs” in column three of [link] , and column four will show gross margin by customer instead of profitability by customer. For many managers, gross margin by customer gives them the essential information they need without going through the additional step of trying to allocate costs to customers, which is clouded by its inherent inaccuracies.
Notification Switch
Would you like to follow the 'Business fundamentals' conversation and receive update notifications?

|
|

|
|

|
|

|
|

|
|

|
|

|
|

|
|

|
|

|
|

|