

| << Chapter < Page | Chapter >> Page > |
One contemporary extinction rate estimate uses the extinctions in the written record since the year 1500. For birds alone this method yields an estimate of 26 E/MSY. However, this value may be underestimated for three reasons. First, many species would not have been described until much later in the time period, so their loss would have gone unnoticed. Second, the number of recently extinct species is increasing because extinct species now are being described from skeletal remains. And third, some species are probably already extinct even though conservationists are reluctant to name them as such. Taking these factors into account raises the estimated extinction rate closer to 100 E/MSY. The predicted rate by the end of the century is 1500 E/MSY.
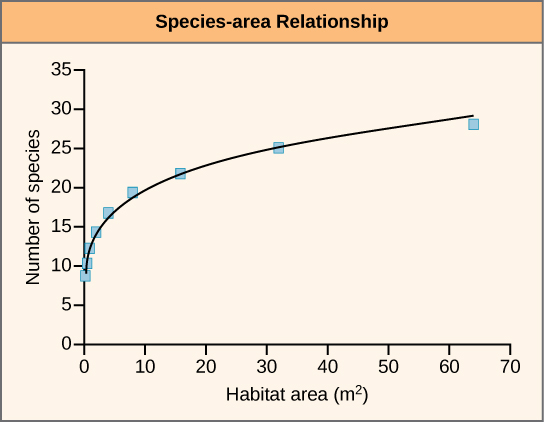
A second approach to estimating present-time extinction rates is to correlate species loss with habitat loss by measuring forest-area loss and understanding species-area relationships. The species-area relationship is the rate at which new species are seen when the area surveyed is increased. Studies have shown that the number of species present increases as the size of the island increases. This phenomenon has also been shown to hold true in other habitats as well. Turning this relationship around, if the habitat area is reduced, the number of species living there will also decline. Estimates of extinction rates based on habitat loss and species-area relationships have suggested that with about 90 percent habitat loss an expected 50 percent of species would become extinct. Species-area estimates have led to species extinction rate calculations of about 1000 E/MSY and higher. In general, actual observations do not show this amount of loss and suggestions have been made that there is a delay in extinction. Recent work has also called into question the applicability of the species-area relationship when estimating the loss of species. This work argues that the species-area relationship leads to an overestimate of extinction rates. A better relationship to use may be the endemics-area relationship. Using this method would bring estimates down to around 500 E/MSY in the coming century. Note that this value is still 500 times the background rate.
Check out this interactive exploration of endangered and extinct species, their ecosystems, and the causes of the endangerment or extinction.
Biodiversity exists at multiple levels of organization and is measured in different ways depending on the goals of those taking the measurements. These measurements include numbers of species, genetic diversity, chemical diversity, and ecosystem diversity. The number of described species is estimated to be 1.5 million with about 17,000 new species being described each year. Estimates for the total number of species on Earth vary but are on the order of 10 million. Biodiversity is negatively correlated with latitude for most taxa, meaning that biodiversity is higher in the tropics. The mechanism for this pattern is not known with certainty, but several plausible hypotheses have been advanced.
Five mass extinctions with losses of more than 50 percent of extant species are observable in the fossil record. Biodiversity recovery times after mass extinctions vary, but have been up to 30 million years. Recent extinctions are recorded in written history and are the basis for one method of estimating contemporary extinction rates. The other method uses measures of habitat loss and species-area relationships. Estimates of contemporary extinction rates vary, but some rates are as high as 500 times the background rate, as determined from the fossil record, and are predicted to rise.
[link] Scientists measured the relative abundance of fern spores above and below the K-Pg boundary in this rock sample. Which of the following statements most likely represents their findings?
[link] A. An abundance of fern spores from several species was found below the K-Pg boundary, but none was found above.
Notification Switch
Would you like to follow the 'Biology' conversation and receive update notifications?

|
|
|
|
|

|
|

|
|

|
|

|
|

|
|

|
|

|
|

|
|
|
|
|
|
|