<< Chapter < Page Chapter >> Page >
By the end of this section, you will be able to:
  • Discuss how human population growth can be exponential
  • Explain how humans have expanded the carrying capacity of their habitat
  • Relate population growth and age structure to the level of economic development in different countries
  • Discuss the long-term implications of unchecked human population growth

Concepts of animal population dynamics can be applied to human population growth. Humans are not unique in their ability to alter their environment. For example, beaver dams alter the stream environment where they are built. Humans, however, have the ability to alter their environment to increase its carrying capacity sometimes to the detriment of other species (e.g., via artificial selection for crops that have a higher yield). Earth’s human population is growing rapidly, to the extent that some worry about the ability of the earth’s environment to sustain this population, as long-term exponential growth carries the potential risks of famine, disease, and large-scale death.

Although humans have increased the carrying capacity of their environment, the technologies used to achieve this transformation have caused unprecedented changes to Earth’s environment, altering ecosystems to the point where some may be in danger of collapse. The depletion of the ozone layer, erosion due to acid rain, and damage from global climate change are caused by human activities. The ultimate effect of these changes on our carrying capacity is unknown. As some point out, it is likely that the negative effects of increasing carrying capacity will outweigh the positive ones—the carrying capacity of the world for human beings might actually decrease.

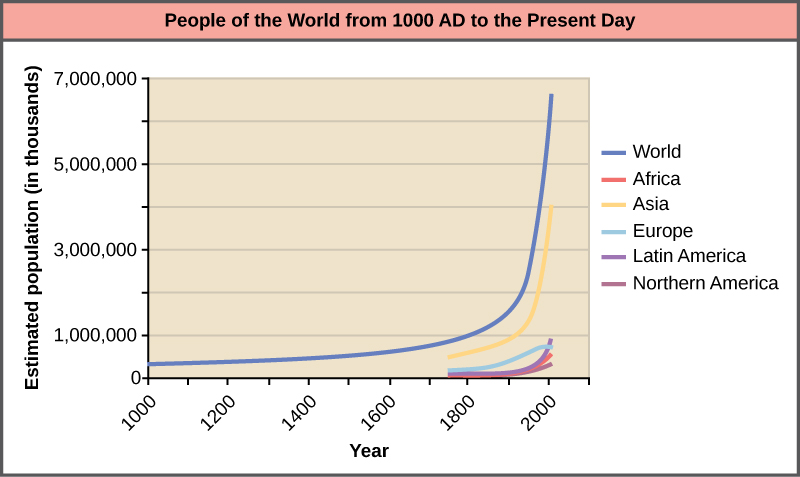
The world’s human population is currently experiencing exponential growth even though human reproduction is far below its biotic potential ( [link] ). To reach its biotic potential, all females would have to become pregnant every nine months or so during their reproductive years. Also, resources would have to be such that the environment would support such growth. Neither of these two conditions exists. In spite of this fact, human population is still growing exponentially.

Graph plots the world population growth from 1000 AD to the present. The curve starts out flat, and then becomes increasingly steep. A sharp increase in population occurs around 1900. In 1000 AD the population was around 265 million. In 2000 it was around 6 billion. Populations of various parts of the world are also plotted, including Africa, Asia, Europe, Latin America, North America, and Oceania. With the exception of Europe, the change in population in each region is similar to the change in world population. In Europe, the population is now stagnant.
Human population growth since 1000 AD is exponential (dark blue line). Notice that while the population in Asia (yellow line), which has many economically underdeveloped countries, is increasing exponentially, the population in Europe (light blue line), where most of the countries are economically developed, is growing much more slowly.

A consequence of exponential human population growth is the time that it takes to add a particular number of humans to the Earth is becoming shorter. [link] shows that 123 years were necessary to add 1 billion humans in 1930, but it only took 24 years to add two billion people between 1975 and 1999. As already discussed, at some point it would appear that our ability to increase our carrying capacity indefinitely on a finite world is uncertain. Without new technological advances, the human growth rate has been predicted to slow in the coming decades. However, the population will still be increasing and the threat of overpopulation remains.

Questions & Answers

A golfer on a fairway is 70 m away from the green, which sits below the level of the fairway by 20 m. If the golfer hits the ball at an angle of 40° with an initial speed of 20 m/s, how close to the green does she come?
Aislinn Reply
cm
tijani
what is titration
John Reply
what is physics
Siyaka Reply
A mouse of mass 200 g falls 100 m down a vertical mine shaft and lands at the bottom with a speed of 8.0 m/s. During its fall, how much work is done on the mouse by air resistance
Jude Reply
Can you compute that for me. Ty
Jude
what is the dimension formula of energy?
David Reply
what is viscosity?
David
what is inorganic
emma Reply
what is chemistry
Youesf Reply
what is inorganic
emma
Chemistry is a branch of science that deals with the study of matter,it composition,it structure and the changes it undergoes
Adjei
please, I'm a physics student and I need help in physics
Adjanou
chemistry could also be understood like the sexual attraction/repulsion of the male and female elements. the reaction varies depending on the energy differences of each given gender. + masculine -female.
Pedro
A ball is thrown straight up.it passes a 2.0m high window 7.50 m off the ground on it path up and takes 1.30 s to go past the window.what was the ball initial velocity
Krampah Reply
2. A sled plus passenger with total mass 50 kg is pulled 20 m across the snow (0.20) at constant velocity by a force directed 25° above the horizontal. Calculate (a) the work of the applied force, (b) the work of friction, and (c) the total work.
Sahid Reply
you have been hired as an espert witness in a court case involving an automobile accident. the accident involved car A of mass 1500kg which crashed into stationary car B of mass 1100kg. the driver of car A applied his brakes 15 m before he skidded and crashed into car B. after the collision, car A s
Samuel Reply
can someone explain to me, an ignorant high school student, why the trend of the graph doesn't follow the fact that the higher frequency a sound wave is, the more power it is, hence, making me think the phons output would follow this general trend?
Joseph Reply
Nevermind i just realied that the graph is the phons output for a person with normal hearing and not just the phons output of the sound waves power, I should read the entire thing next time
Joseph
Follow up question, does anyone know where I can find a graph that accuretly depicts the actual relative "power" output of sound over its frequency instead of just humans hearing
Joseph
"Generation of electrical energy from sound energy | IEEE Conference Publication | IEEE Xplore" ***ieeexplore.ieee.org/document/7150687?reload=true
Ryan
what's motion
Maurice Reply
what are the types of wave
Maurice
answer
Magreth
progressive wave
Magreth
hello friend how are you
Muhammad Reply
fine, how about you?
Mohammed
hi
Mujahid
A string is 3.00 m long with a mass of 5.00 g. The string is held taut with a tension of 500.00 N applied to the string. A pulse is sent down the string. How long does it take the pulse to travel the 3.00 m of the string?
yasuo Reply
Who can show me the full solution in this problem?
Reofrir Reply
Got questions? Join the online conversation and get instant answers!
Jobilize.com Reply

Get Jobilize Job Search Mobile App in your pocket Now!

Get it on Google Play Download on the App Store Now


Source:  OpenStax, Biology. OpenStax CNX. Feb 29, 2016 Download for free at http://cnx.org/content/col11448/1.10
Google Play and the Google Play logo are trademarks of Google Inc.

Notification Switch

Would you like to follow the 'Biology' conversation and receive update notifications?

Ask