<< Chapter < Page Chapter >> Page >

Learning objectives

By the end of this section, you will be able to:

  • Explain why the spectral lines of photons we observe from an object will change as a result of the object’s motion toward or away from us
  • Describe how we can use the Doppler effect to deduce how fast astronomical objects are moving through space

The last two sections introduced you to many new concepts, and we hope that through those, you have seen one major idea emerge. Astronomers can learn about the elements in stars and galaxies by decoding the information in their spectral lines. There is a complicating factor in learning how to decode the message of starlight, however. If a star is moving toward or away from us, its lines will be in a slightly different place in the spectrum from where they would be in a star at rest. And most objects in the universe do have some motion relative to the Sun.

Motion affects waves

In 1842, Christian Doppler first measured the effect of motion on waves by hiring a group of musicians to play on an open railroad car as it was moving along the track. He then applied what he learned to all waves, including light, and pointed out that if a light source is approaching or receding from the observer, the light waves will be, respectively, crowded more closely together or spread out. The general principle, now known as the Doppler effect    , is illustrated in [link] .

Doppler effect.

This figure illustrates the Doppler effect. Part A shows even concentric rings representing waves moving over an observer. The center of the rings is labeled “S” for source, and from innermost to outermost the rings are labeled “4”, “3”, “2”, and “1”. An arrow points outward from the outmost ring, and is labeled “to observer”. Part B shows uneven concentric rings representing waves moving over three observers. The center of the rings is labeled “S 4” for source, and from innermost to outermost the rings are labeled “4”, “3”, “2”, and “1”. Labels “S 3”, “S 2”, and “S 1” are marked vertically above “S 4”, and represent the movement of the source “to Observer A” at the bottom of the outmost ring. “To observer B” is labeled at the left, and “to observer C” at the top of the outmost ring.
(a) A source, S, makes waves whose numbered crests (1, 2, 3, and 4) wash over a stationary observer. (b) The source S now moves toward observer A and away from observer C . Wave crest 1 was emitted when the source was at position S4, crest 2 at position S2, and so forth. Observer A sees waves compressed by this motion and sees a blueshift (if the waves are light). Observer C sees the waves stretched out by the motion and sees a redshift. Observer B , whose line of sight is perpendicular to the source’s motion, sees no change in the waves (and feels left out).

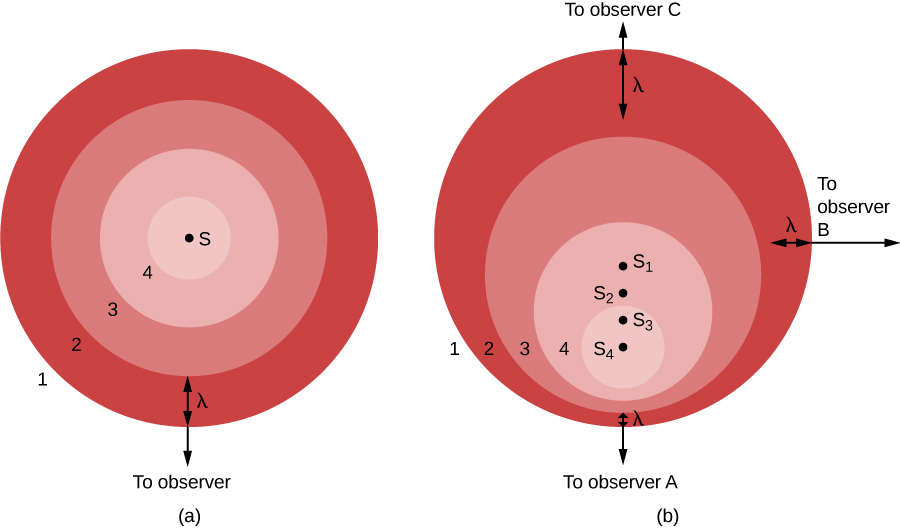
In part (a) of the figure, the light source (S) is at rest with respect to the observer. The source gives off a series of waves, whose crests we have labeled 1, 2, 3, and 4. The light waves spread out evenly in all directions, like the ripples from a splash in a pond. The crests are separated by a distance, λ, where λ is the wavelength. The observer, who happens to be located in the direction of the bottom of the image, sees the light waves coming nice and evenly, one wavelength apart. Observers located anywhere else would see the same thing.

On the other hand, if the source of light is moving with respect to the observer, as seen in part (b), the situation is more complicated. Between the time one crest is emitted and the next one is ready to come out, the source has moved a bit, toward the bottom of the page. From the point of view of observer A , this motion of the source has decreased the distance between crests—it’s squeezing the crests together, this observer might say.

In part (b), we show the situation from the perspective of three observers. The source is seen in four positions, S 1 , S 2 , S 3 , and S 4 , each corresponding to the emission of one wave crest. To observer A , the waves seem to follow one another more closely, at a decreased wavelength and thus increased frequency. (Remember, all light waves travel at the speed of light through empty space, no matter what. This means that motion cannot affect the speed, but only the wavelength and the frequency. As the wavelength decreases, the frequency must increase. If the waves are shorter, more will be able to move by during each second.)

Questions & Answers

how do you get the 2/50
Abba Reply
number of sport play by 50 student construct discrete data
Aminu Reply
width of the frangebany leaves on how to write a introduction
Theresa Reply
Solve the mean of variance
Veronica Reply
Step 1: Find the mean. To find the mean, add up all the scores, then divide them by the number of scores. ... Step 2: Find each score's deviation from the mean. ... Step 3: Square each deviation from the mean. ... Step 4: Find the sum of squares. ... Step 5: Divide the sum of squares by n – 1 or N.
kenneth
what is error
Yakuba Reply
Is mistake done to something
Vutshila
Hy
anas
hy
What is the life teble
anas
hy
Jibrin
statistics is the analyzing of data
Tajudeen Reply
what is statics?
Zelalem Reply
how do you calculate mean
Gloria Reply
diveving the sum if all values
Shaynaynay
let A1,A2 and A3 events be independent,show that (A1)^c, (A2)^c and (A3)^c are independent?
Fisaye Reply
what is statistics
Akhisani Reply
data collected all over the world
Shaynaynay
construct a less than and more than table
Imad Reply
The sample of 16 students is taken. The average age in the sample was 22 years with astandard deviation of 6 years. Construct a 95% confidence interval for the age of the population.
Aschalew Reply
Bhartdarshan' is an internet-based travel agency wherein customer can see videos of the cities they plant to visit. The number of hits daily is a normally distributed random variable with a mean of 10,000 and a standard deviation of 2,400 a. what is the probability of getting more than 12,000 hits? b. what is the probability of getting fewer than 9,000 hits?
Akshay Reply
Bhartdarshan'is an internet-based travel agency wherein customer can see videos of the cities they plan to visit. The number of hits daily is a normally distributed random variable with a mean of 10,000 and a standard deviation of 2,400. a. What is the probability of getting more than 12,000 hits
Akshay
1
Bright
Sorry i want to learn more about this question
Bright
Someone help
Bright
a= 0.20233 b=0.3384
Sufiyan
a
Shaynaynay
How do I interpret level of significance?
Mohd Reply
It depends on your business problem or in Machine Learning you could use ROC- AUC cruve to decide the threshold value
Shivam
how skewness and kurtosis are used in statistics
Owen Reply
yes what is it
Taneeya
Got questions? Join the online conversation and get instant answers!
Jobilize.com Reply

Get Jobilize Job Search Mobile App in your pocket Now!

Get it on Google Play Download on the App Store Now


Source:  OpenStax, Astronomy. OpenStax CNX. Apr 12, 2017 Download for free at http://cnx.org/content/col11992/1.13
Google Play and the Google Play logo are trademarks of Google Inc.

Notification Switch

Would you like to follow the 'Astronomy' conversation and receive update notifications?

Ask