<< Chapter < Page Chapter >> Page >

Learning objectives

By the end of this section, you will be able to:

  • Give a brief history of how gamma-ray burst s were discovered and what instruments made the discovery possible
  • Explain why astronomers think that gamma-ray bursts beam their energy rather than it radiating uniformly in all directions
  • Describe how the radiation from a gamma-ray burst and its afterglow is produced
  • Explain how short-duration gamma-ray bursts differ from longer ones, and describe the process that makes short-duration gamma-ray bursts
  • Explain why gamma-ray bursts may help us understand the early universe

Everybody loves a good mystery, and astronomers are no exception. The mystery we will discuss in this section was first discovered in the mid-1960s, not via astronomical research, but as a result of a search for the tell-tale signs of nuclear weapon explosions. The US Defense Department launched a series of Vela satellites to make sure that no country was violating a treaty that banned the detonation of nuclear weapons in space.

Since nuclear explosions produce the most energetic form of electromagnetic waves called gamma rays (see Radiation and Spectra ), the Vela satellites contained detectors to search for this type of radiation. The satellites did not detect any confirmed events from human activities, but they did—to everyone’s surprise—detect short bursts of gamma rays coming from random directions in the sky. News of the discovery was first published in 1973; however, the origin of the bursts remained a mystery. No one knew what produced the brief flashes of gamma rays or how far away the sources were.

From a few bursts to thousands

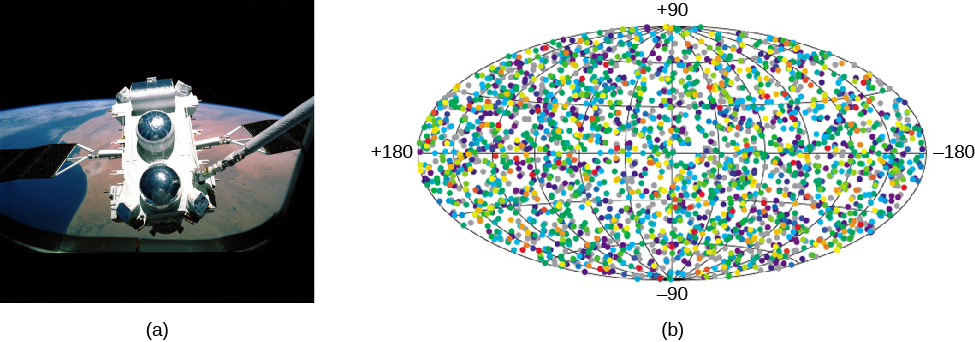
With the launch of the Compton Gamma-Ray Observatory by NASA in 1991, astronomers began to identify many more bursts and to learn more about them ( [link] ). Approximately once per day, the NASA satellite detected a flash of gamma rays somewhere in the sky that lasted from a fraction of a second to several hundred seconds. Before the Compton measurements, astronomers had expected that the most likely place for the bursts to come from was the main disk of our own (pancake-shaped) Galaxy. If this had been the case, however, more bursts would have been seen in the crowded plane of the Milky Way than above or below it. Instead, the sources of the bursts were distributed isotropically ; that is, they could appear anywhere in the sky with no preference for one region over another. Almost never did a second burst come from the same location.

Compton detects gamma-ray bursts.

Compton Detects Gamma Ray Bursts. The GRO is seen in panel (a), at left, from within the cargo bay of Space Shuttle Atlantis with the Earth in the background. Panel (b), at right, shows an all-sky map of GRO obervations. The distribution of gamma-ray bursts is uniform over the entire sky.
(a) In 1991, the Compton Gamma-Ray Observatory was deployed by the Space Shuttle Atlantis. Weighing more than 16 tons, it was one of the largest scientific payloads ever launched into space. (b) This map of gamma-ray burst positions measured by the Compton Gamma-Ray Observatory shows the isotropic (same in all directions), uniform distribution of bursts on the sky. The map is oriented so that the disk of the Milky Way would stretch across the center line (or equator) of the oval. Note that the bursts show no preference at all for the plane of the Milky Way, as many other types of objects in the sky do. Colors indicate the total energy in the burst: red dots indicate long-duration, bright bursts; blue and purple dots show short, weaker bursts. (credit a: modification of work by NASA; credit b: modification of work by NASA/GSFC)

Questions & Answers

What is inflation
Bright Reply
a general and ongoing rise in the level of prices in an economy
AI-Robot
What are the factors that affect demand for a commodity
Florence Reply
differentiate between demand and supply giving examples
Lambiv Reply
differentiated between demand and supply using examples
Lambiv
what is labour ?
Lambiv
how will I do?
Venny Reply
how is the graph works?I don't fully understand
Rezat Reply
information
Eliyee
devaluation
Eliyee
t
WARKISA
hi guys good evening to all
Lambiv
multiple choice question
Aster Reply
appreciation
Eliyee
explain perfect market
Lindiwe Reply
In economics, a perfect market refers to a theoretical construct where all participants have perfect information, goods are homogenous, there are no barriers to entry or exit, and prices are determined solely by supply and demand. It's an idealized model used for analysis,
Ezea
What is ceteris paribus?
Shukri Reply
other things being equal
AI-Robot
When MP₁ becomes negative, TP start to decline. Extuples Suppose that the short-run production function of certain cut-flower firm is given by: Q=4KL-0.6K2 - 0.112 • Where is quantity of cut flower produced, I is labour input and K is fixed capital input (K-5). Determine the average product of lab
Kelo
Extuples Suppose that the short-run production function of certain cut-flower firm is given by: Q=4KL-0.6K2 - 0.112 • Where is quantity of cut flower produced, I is labour input and K is fixed capital input (K-5). Determine the average product of labour (APL) and marginal product of labour (MPL)
Kelo
yes,thank you
Shukri
Can I ask you other question?
Shukri
what is monopoly mean?
Habtamu Reply
What is different between quantity demand and demand?
Shukri Reply
Quantity demanded refers to the specific amount of a good or service that consumers are willing and able to purchase at a give price and within a specific time period. Demand, on the other hand, is a broader concept that encompasses the entire relationship between price and quantity demanded
Ezea
ok
Shukri
how do you save a country economic situation when it's falling apart
Lilia Reply
what is the difference between economic growth and development
Fiker Reply
Economic growth as an increase in the production and consumption of goods and services within an economy.but Economic development as a broader concept that encompasses not only economic growth but also social & human well being.
Shukri
production function means
Jabir
What do you think is more important to focus on when considering inequality ?
Abdisa Reply
any question about economics?
Awais Reply
sir...I just want to ask one question... Define the term contract curve? if you are free please help me to find this answer 🙏
Asui
it is a curve that we get after connecting the pareto optimal combinations of two consumers after their mutually beneficial trade offs
Awais
thank you so much 👍 sir
Asui
In economics, the contract curve refers to the set of points in an Edgeworth box diagram where both parties involved in a trade cannot be made better off without making one of them worse off. It represents the Pareto efficient allocations of goods between two individuals or entities, where neither p
Cornelius
In economics, the contract curve refers to the set of points in an Edgeworth box diagram where both parties involved in a trade cannot be made better off without making one of them worse off. It represents the Pareto efficient allocations of goods between two individuals or entities,
Cornelius
Suppose a consumer consuming two commodities X and Y has The following utility function u=X0.4 Y0.6. If the price of the X and Y are 2 and 3 respectively and income Constraint is birr 50. A,Calculate quantities of x and y which maximize utility. B,Calculate value of Lagrange multiplier. C,Calculate quantities of X and Y consumed with a given price. D,alculate optimum level of output .
Feyisa Reply
Answer
Feyisa
c
Jabir
Got questions? Join the online conversation and get instant answers!
Jobilize.com Reply

Get Jobilize Job Search Mobile App in your pocket Now!

Get it on Google Play Download on the App Store Now


Source:  OpenStax, Astronomy. OpenStax CNX. Apr 12, 2017 Download for free at http://cnx.org/content/col11992/1.13
Google Play and the Google Play logo are trademarks of Google Inc.

Notification Switch

Would you like to follow the 'Astronomy' conversation and receive update notifications?

Ask