<< Chapter < Page Chapter >> Page >

Learning objectives

By the end of this section, you will be able to:

  • Describe how some stars vary their light output and why such stars are important
  • Explain the importance of pulsating variable stars, such as cepheids and RR Lyrae-type stars, to our study of the universe

Let’s briefly review the key reasons that measuring distances to the stars is such a struggle. As discussed in The Brightness of Stars , our problem is that stars come in a bewildering variety of intrinsic luminosities. (If stars were light bulbs, we’d say they come in a wide range of wattages.) Suppose, instead, that all stars had the same “wattage” or luminosity. In that case, the more distant ones would always look dimmer, and we could tell how far away a star is simply by how dim it appeared. In the real universe, however, when we look at a star in our sky (with eye or telescope) and measure its apparent brightness, we cannot know whether it looks dim because it’s a low-wattage bulb or because it is far away, or perhaps some of each.

Astronomers need to discover something else about the star that allows us to “read off” its intrinsic luminosity—in effect, to know what the star’s true wattage is. With this information, we can then attribute how dim it looks from Earth to its distance. Recall that the apparent brightness of an object decreases with the square of the distance to that object. If two objects have the same luminosity but one is three times farther than the other, the more distant one will look nine times fainter. Therefore, if we know the luminosity of a star and its apparent brightness, we can calculate how far away it is. Astronomers have long searched for techniques that would somehow allow us to determine the luminosity of a star—and it is to these techniques that we turn next.

Variable stars

The breakthrough in measuring distances to remote parts of our Galaxy, and to other galaxies as well, came from the study of variable star s. Most stars are constant in their luminosity, at least to within a percent or two. Like the Sun, they generate a steady flow of energy from their interiors. However, some stars are seen to vary in brightness and, for this reason, are called variable stars . Many such stars vary on a regular cycle, like the flashing bulbs that decorate stores and homes during the winter holidays.

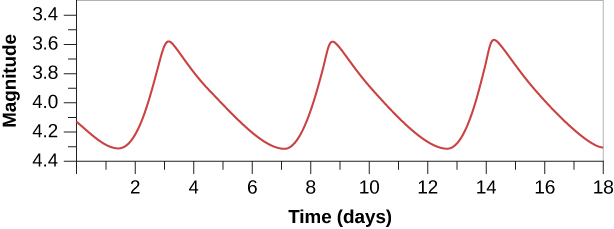
Let’s define some tools to help us keep track of how a star varies. A graph that shows how the brightness of a variable star changes with time is called a light curve    ( [link] ). The maximum is the point of the light curve where the star has its greatest brightness; the minimum is the point where it is faintest. If the light variations repeat themselves periodically, the interval between the two maxima is called the period of the star. (If this kind of graph looks familiar, it is because we introduced it in Diameters of Stars .)

Cepheid light curve.

Plot of a Cepheid Light Curve. In this graph the vertical axis is labeled “Magnitude,” and goes from 4.4 (at the bottom) to 3.4 in increments of 0.2. The horizontal axis is labeled “Time (days),” ranging from 0 to 18 in increments of 1 day. The plotted curve begins at day zero near magnitude 4.1. The curve dips to the minimum magnitude of 4.3 at day 1.5, then rises rapidly to the maximum magnitude of 3.6 at day 3. The curve slowly dips down again to magnitude 4.3 at day 7. The curve repeats two more times to day 18, giving the plot the appearance of a saw blade.
This light curve shows how the brightness changes with time for a typical cepheid variable, with a period of about 6 days.

Pulsating variables

There are two special types of variable stars for which—as we will see—measurements of the light curve give us accurate distances. These are called cepheid    and RR Lyrae    variables, both of which are pulsating variable stars . Such a star actually changes its diameter with time—periodically expanding and contracting, as your chest does when you breathe. We now understand that these stars are going through a brief unstable stage late in their lives.

Questions & Answers

how do you get the 2/50
Abba Reply
number of sport play by 50 student construct discrete data
Aminu Reply
width of the frangebany leaves on how to write a introduction
Theresa Reply
Solve the mean of variance
Veronica Reply
Step 1: Find the mean. To find the mean, add up all the scores, then divide them by the number of scores. ... Step 2: Find each score's deviation from the mean. ... Step 3: Square each deviation from the mean. ... Step 4: Find the sum of squares. ... Step 5: Divide the sum of squares by n – 1 or N.
kenneth
what is error
Yakuba Reply
Is mistake done to something
Vutshila
Hy
anas
hy
What is the life teble
anas
hy
Jibrin
statistics is the analyzing of data
Tajudeen Reply
what is statics?
Zelalem Reply
how do you calculate mean
Gloria Reply
diveving the sum if all values
Shaynaynay
let A1,A2 and A3 events be independent,show that (A1)^c, (A2)^c and (A3)^c are independent?
Fisaye Reply
what is statistics
Akhisani Reply
data collected all over the world
Shaynaynay
construct a less than and more than table
Imad Reply
The sample of 16 students is taken. The average age in the sample was 22 years with astandard deviation of 6 years. Construct a 95% confidence interval for the age of the population.
Aschalew Reply
Bhartdarshan' is an internet-based travel agency wherein customer can see videos of the cities they plant to visit. The number of hits daily is a normally distributed random variable with a mean of 10,000 and a standard deviation of 2,400 a. what is the probability of getting more than 12,000 hits? b. what is the probability of getting fewer than 9,000 hits?
Akshay Reply
Bhartdarshan'is an internet-based travel agency wherein customer can see videos of the cities they plan to visit. The number of hits daily is a normally distributed random variable with a mean of 10,000 and a standard deviation of 2,400. a. What is the probability of getting more than 12,000 hits
Akshay
1
Bright
Sorry i want to learn more about this question
Bright
Someone help
Bright
a= 0.20233 b=0.3384
Sufiyan
a
Shaynaynay
How do I interpret level of significance?
Mohd Reply
It depends on your business problem or in Machine Learning you could use ROC- AUC cruve to decide the threshold value
Shivam
how skewness and kurtosis are used in statistics
Owen Reply
yes what is it
Taneeya
Got questions? Join the online conversation and get instant answers!
Jobilize.com Reply
Practice Key Terms 5

Get Jobilize Job Search Mobile App in your pocket Now!

Get it on Google Play Download on the App Store Now


Source:  OpenStax, Astronomy. OpenStax CNX. Apr 12, 2017 Download for free at http://cnx.org/content/col11992/1.13
Google Play and the Google Play logo are trademarks of Google Inc.

Notification Switch

Would you like to follow the 'Astronomy' conversation and receive update notifications?

Ask