<< Chapter < Page Chapter >> Page >
By the end of this section, you will be able to:
  • Use geoboards to model slope
  • Use m = r i s e r u n to find the slope of a line from its graph
  • Find the slope of horizontal and vertical lines
  • Use the slope formula to find the slope of a line between two points
  • Graph a line given a point and the slope
  • Solve slope applications

Before you get started, take this readiness quiz.

  1. Simplify: 1 4 8 2 .
    If you missed this problem, review [link] .
  2. Divide: 0 4 , 4 0 .
    If you missed this problem, review [link] .
  3. Simplify: 15 −3 , −15 3 , −15 −3 .
    If you missed this problem, review [link] .

When you graph linear equations, you may notice that some lines tilt up as they go from left to right and some lines tilt down. Some lines are very steep and some lines are flatter. What determines whether a line tilts up or down or if it is steep or flat?

In mathematics, the ‘tilt’ of a line is called the slope of the line. The concept of slope has many applications in the real world. The pitch of a roof, grade of a highway, and a ramp for a wheelchair are some examples where you literally see slopes. And when you ride a bicycle, you feel the slope as you pump uphill or coast downhill.

In this section, we will explore the concept of slope.

Use geoboards to model slope

A geoboard    is a board with a grid of pegs on it. Using rubber bands on a geoboard gives us a concrete way to model lines on a coordinate grid. By stretching a rubber band between two pegs on a geoboard, we can discover how to find the slope of a line.

Doing the Manipulative Mathematics activity “Exploring Slope” will help you develop a better understanding of the slope of a line. (Graph paper can be used instead of a geoboard, if needed.)

We’ll start by stretching a rubber band between two pegs as shown in [link] .

The figure shows a grid of evenly spaced pegs. There are 5 columns and 5 rows of pegs. A rubber band is stretched between the peg in column 1, row 4 and the peg in column 4, row 2, forming a line.

Doesn’t it look like a line?

Now we stretch one part of the rubber band straight up from the left peg and around a third peg to make the sides of a right triangle, as shown in [link]

The figure shows a grid of evenly spaced pegs. There are 5 columns and 5 rows of pegs. A rubber band is stretched between the peg in column 1, row 2, the peg in column 1, row 4, and the peg in column 4, row 2, forming a right triangle. The 1, 2 peg is the vertex of the 90 degree angle, while the line between the 1, 4 and 4, 2 pegs forms the hypotenuse of the triangle.

We carefully make a 90º angle around the third peg, so one of the newly formed lines is vertical and the other is horizontal.

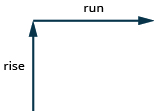
To find the slope of the line, we measure the distance along the vertical and horizontal sides of the triangle. The vertical distance is called the rise    and the horizontal distance is called the run    , as shown in [link] .

In this illustration, there are two perpendicular lines with arrows. The first line extends straight upward and is labeled “rise”. The second arrow extends straight rightward and is labeled “run”.

If our geoboard    and rubber band look just like the one shown in [link] , the rise is 2. The rubber band goes up 2 units. (Each space is one unit.)
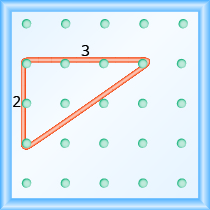
The figure shows a grid of evenly spaced pegs. There are 5 columns and 5 rows of pegs. A rubber band is stretched between the peg in column 1, row 2, the peg in column 1, row 4, and the peg in column 4, row 2, forming a right triangle where the 1, 2 peg is the vertex of the 90 degree angle and the line between the 1, 4 peg and the 4, 2 peg forms the hypotenuse. The line between the 1, 2 peg and the 1, 4 peg is labeled “2”. The line between the 1, 2 peg and the 4, 2 peg is labeled “3”.
The rise on this geoboard is 2, as the rubber band goes up two units.

What is the run?

The rubber band goes across 3 units. The run is 3 (see [link] ).

The slope of a line is the ratio of the rise to the run. In mathematics, it is always referred to with the letter m .

Slope of a line

The slope of a line    of a line is m = rise run .

The rise    measures the vertical change and the run    measures the horizontal change between two points on the line.

What is the slope of the line on the geoboard in [link] ?

m = rise run m = 2 3

The line has slope 2 3 . This means that the line rises 2 units for every 3 units of run.

When we work with geoboards, it is a good idea to get in the habit of starting at a peg on the left and connecting to a peg to the right. If the rise goes up it is positive and if it goes down it is negative. The run will go from left to right and be positive.

Questions & Answers

Ayele, K., 2003. Introductory Economics, 3rd ed., Addis Ababa.
Widad Reply
can you send the book attached ?
Ariel
?
Ariel
What is economics
Widad Reply
the study of how humans make choices under conditions of scarcity
AI-Robot
U(x,y) = (x×y)1/2 find mu of x for y
Desalegn Reply
U(x,y) = (x×y)1/2 find mu of x for y
Desalegn
what is ecnomics
Jan Reply
this is the study of how the society manages it's scarce resources
Belonwu
what is macroeconomic
John Reply
macroeconomic is the branch of economics which studies actions, scale, activities and behaviour of the aggregate economy as a whole.
husaini
etc
husaini
difference between firm and industry
husaini Reply
what's the difference between a firm and an industry
Abdul
firm is the unit which transform inputs to output where as industry contain combination of firms with similar production 😅😅
Abdulraufu
Suppose the demand function that a firm faces shifted from Qd  120 3P to Qd  90  3P and the supply function has shifted from QS  20  2P to QS 10  2P . a) Find the effect of this change on price and quantity. b) Which of the changes in demand and supply is higher?
Toofiq Reply
explain standard reason why economic is a science
innocent Reply
factors influencing supply
Petrus Reply
what is economic.
Milan Reply
scares means__________________ends resources. unlimited
Jan
economics is a science that studies human behaviour as a relationship b/w ends and scares means which have alternative uses
Jan
calculate the profit maximizing for demand and supply
Zarshad Reply
Why qualify 28 supplies
Milan
what are explicit costs
Nomsa Reply
out-of-pocket costs for a firm, for example, payments for wages and salaries, rent, or materials
AI-Robot
concepts of supply in microeconomics
David Reply
economic overview notes
Amahle Reply
identify a demand and a supply curve
Salome Reply
i don't know
Parul
there's a difference
Aryan
Demand curve shows that how supply and others conditions affect on demand of a particular thing and what percent demand increase whith increase of supply of goods
Israr
Hi Sir please how do u calculate Cross elastic demand and income elastic demand?
Abari
Got questions? Join the online conversation and get instant answers!
Jobilize.com Reply
Practice Key Terms 7

Get Jobilize Job Search Mobile App in your pocket Now!

Get it on Google Play Download on the App Store Now


Source:  OpenStax, Elementary algebra. OpenStax CNX. Jan 18, 2017 Download for free at http://cnx.org/content/col12116/1.2
Google Play and the Google Play logo are trademarks of Google Inc.

Notification Switch

Would you like to follow the 'Elementary algebra' conversation and receive update notifications?

Ask