-
Home
- Algebra and trigonometry
- Functions
- Functions and function notation
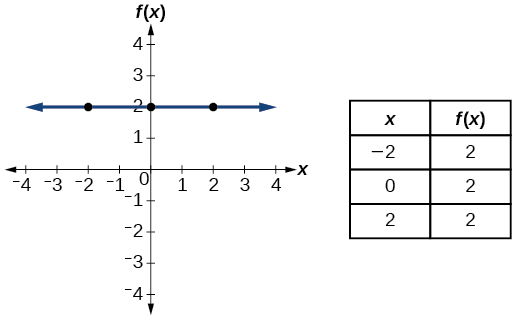
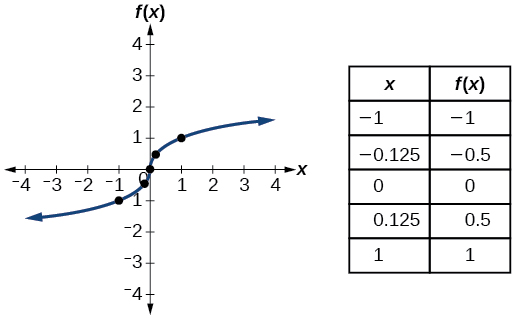
We will see these toolkit functions, combinations of toolkit functions, their graphs, and their transformations frequently throughout this book. It will be very helpful if we can recognize these toolkit functions and their features quickly by name, formula, graph, and basic table properties. The graphs and sample table values are included with each function shown in
[link] .
| Toolkit Functions |
| Name |
Function |
Graph |
| Constant |
where
is a constant |
 |
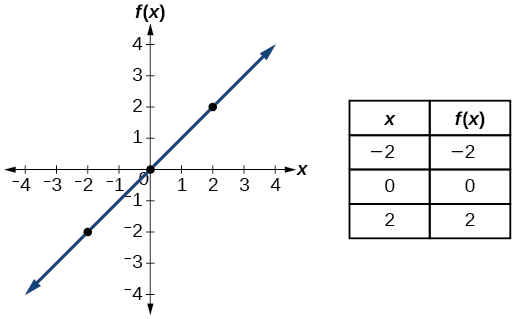
| Identity |
|
 |
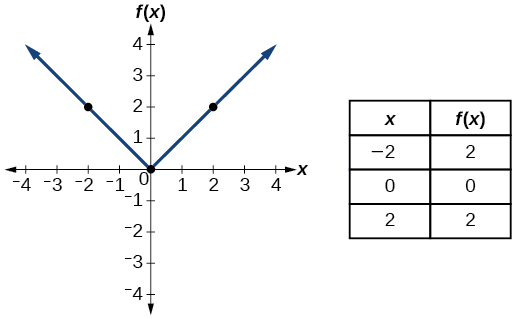
| Absolute value |
|
 |
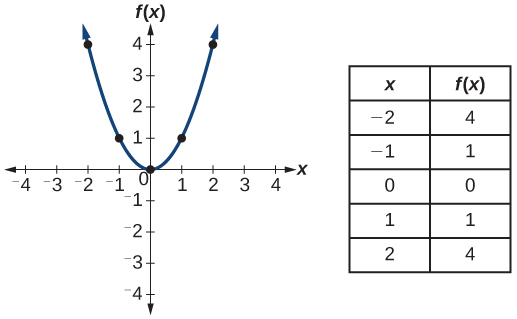
| Quadratic |
|
 |
| Cubic |
|
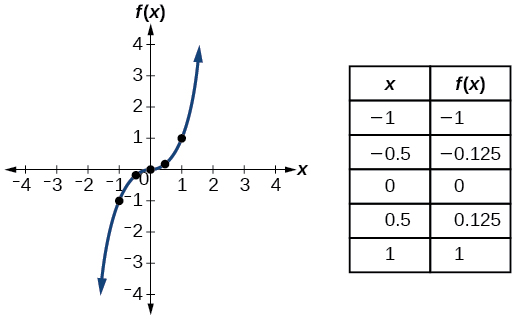 |
| Reciprocal |
|
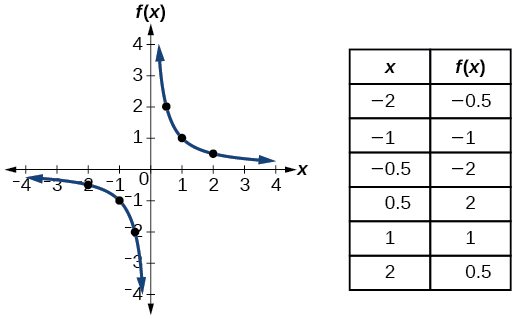 |
| Reciprocal squared |
|
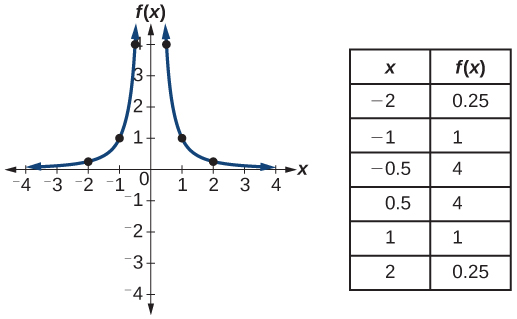 |
| Square root |
|
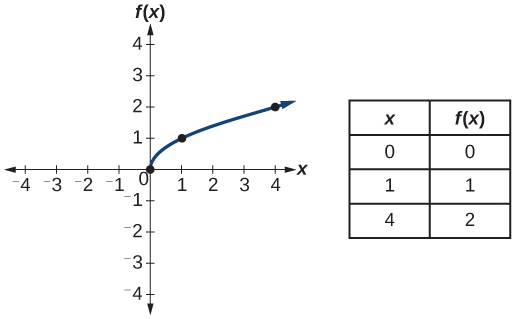 |
| Cube root |
|
 |
Key equations
| Constant function |
where
is a constant |
| Identity function |
|
| Absolute value function |
|
| Quadratic function |
|
| Cubic function |
|
| Reciprocal function |
|
| Reciprocal squared function |
|
| Square root function |
|
| Cube root function |
|
Key concepts
- A relation is a set of ordered pairs. A function is a specific type of relation in which each domain value, or input, leads to exactly one range value, or output. See
[link] and
[link] .
- Function notation is a shorthand method for relating the input to the output in the form
See
[link] and
[link] .
- In tabular form, a function can be represented by rows or columns that relate to input and output values. See
[link] .
- To evaluate a function, we determine an output value for a corresponding input value. Algebraic forms of a function can be evaluated by replacing the input variable with a given value. See
[link] and
[link] .
- To solve for a specific function value, we determine the input values that yield the specific output value. See
[link] .
- An algebraic form of a function can be written from an equation. See
[link] and
[link] .
- Input and output values of a function can be identified from a table. See
[link] .
- Relating input values to output values on a graph is another way to evaluate a function. See
[link] .
- A function is one-to-one if each output value corresponds to only one input value. See
[link] .
- A graph represents a function if any vertical line drawn on the graph intersects the graph at no more than one point. See
[link] .
- The graph of a one-to-one function passes the horizontal line test. See
[link] .
Section exercises
Verbal
What is the difference between a relation and a function?
A relation is a set of ordered pairs. A function is a special kind of relation in which no two ordered pairs have the same first coordinate.
Got questions? Get instant answers now!
Why does the vertical line test tell us whether the graph of a relation represents a function?
When a vertical line intersects the graph of a relation more than once, that indicates that for that input there is more than one output. At any particular input value, there can be only one output if the relation is to be a function.
Got questions? Get instant answers now!
Questions & Answers
number of sport play by 50 student construct discrete data
width of the frangebany leaves on how to write a introduction
Solve the mean of variance
Step 1: Find the mean. To find the mean, add up all the scores, then divide them by the number of scores. ...
Step 2: Find each score's deviation from the mean. ...
Step 3: Square each deviation from the mean. ...
Step 4: Find the sum of squares. ...
Step 5: Divide the sum of squares by n – 1 or N.
kenneth
Is mistake done to something
Vutshila
What is the life teble
anas
statistics is the analyzing of data
how do you calculate mean
diveving the sum if all values
Shaynaynay
let A1,A2 and A3 events be independent,show that (A1)^c, (A2)^c and (A3)^c are independent?
data collected all over the world
Shaynaynay
construct a less than and more than table
The sample of 16 students is taken. The average age in the sample was 22 years with astandard deviation of 6 years. Construct a 95% confidence interval for the age of the population.
Bhartdarshan' is an internet-based travel agency wherein customer can see videos of the cities they plant to visit. The number of hits daily is a normally distributed random variable with a mean of 10,000 and a standard deviation of 2,400
a. what is the probability of getting more than 12,000 hits?
b. what is the probability of getting fewer than 9,000 hits?
Bhartdarshan'is an internet-based travel agency wherein customer can see videos of the cities they plan to visit. The number of hits daily is a normally distributed random variable with a mean of 10,000 and a standard deviation of 2,400.
a. What is the probability of getting more than 12,000 hits
Akshay
Sorry i want to learn more about this question
Bright
a= 0.20233
b=0.3384
Sufiyan
How do I interpret level of significance?
It depends on your business problem or in Machine Learning you could use ROC- AUC cruve to decide the threshold value
Shivam
how skewness and kurtosis are used in statistics
Got questions? Join the online conversation and get instant answers!
Source:
OpenStax, Algebra and trigonometry. OpenStax CNX. Nov 14, 2016 Download for free at https://legacy.cnx.org/content/col11758/1.6
Google Play and the Google Play logo are trademarks of Google Inc.


