Finding increasing and decreasing intervals on a graph
Given the function
in
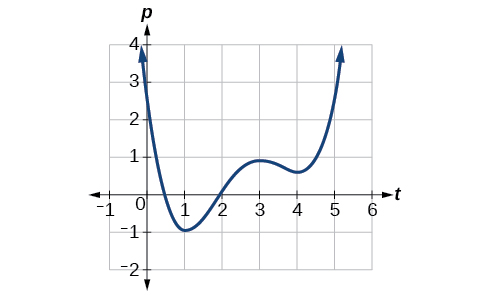
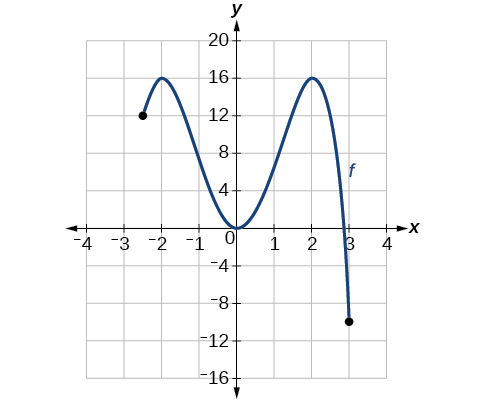
[link] , identify the intervals on which the function appears to be increasing.
We see that the function is not constant on any interval. The function is increasing where it slants upward as we move to the right and decreasing where it slants downward as we move to the right. The function appears to be increasing from
to
and from
on.
In
interval notation , we would say the function appears to be increasing on the interval (1,3) and the interval
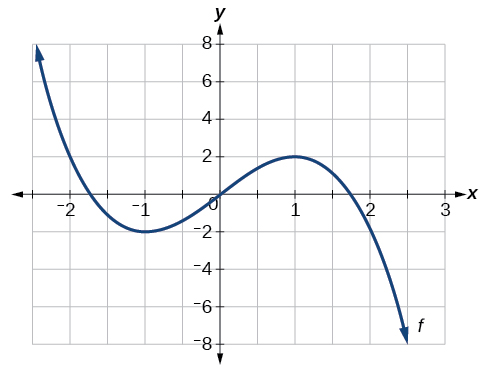
Graph the function
Then use the graph to estimate the local extrema of the function and to determine the intervals on which the function is increasing.
Using technology, we find that the graph of the function looks like that in
[link] . It appears there is a low point, or local minimum, between
and
and a mirror-image high point, or local maximum, somewhere between
and
Graph the function
to estimate the local extrema of the function. Use these to determine the intervals on which the function is increasing and decreasing.
The local maximum appears to occur at
and the local minimum occurs at
The function is increasing on
and decreasing on
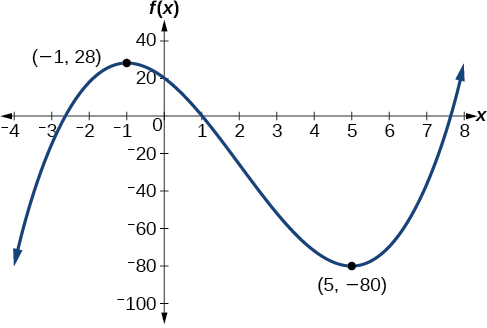
For the function
whose graph is shown in
[link] , find all local maxima and minima.
Observe the graph of
The graph attains a local maximum at
because it is the highest point in an open interval around
The local maximum is the
-coordinate at
which is
The graph attains a local minimum at
because it is the lowest point in an open interval around
The local minimum is the
y -coordinate at
which is
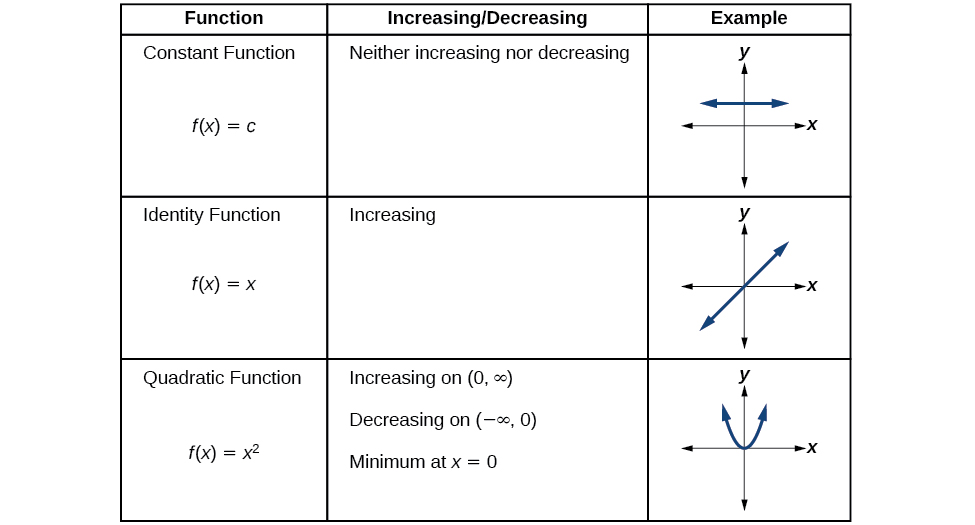
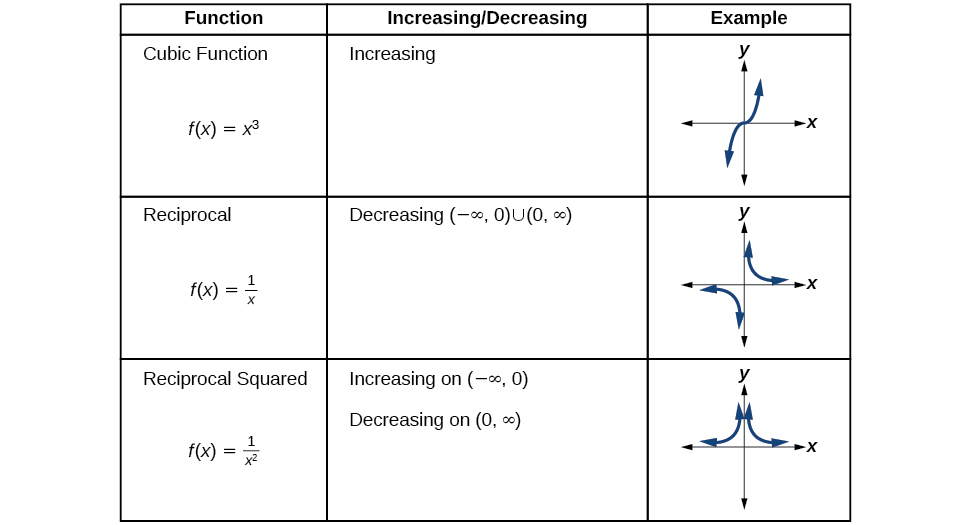
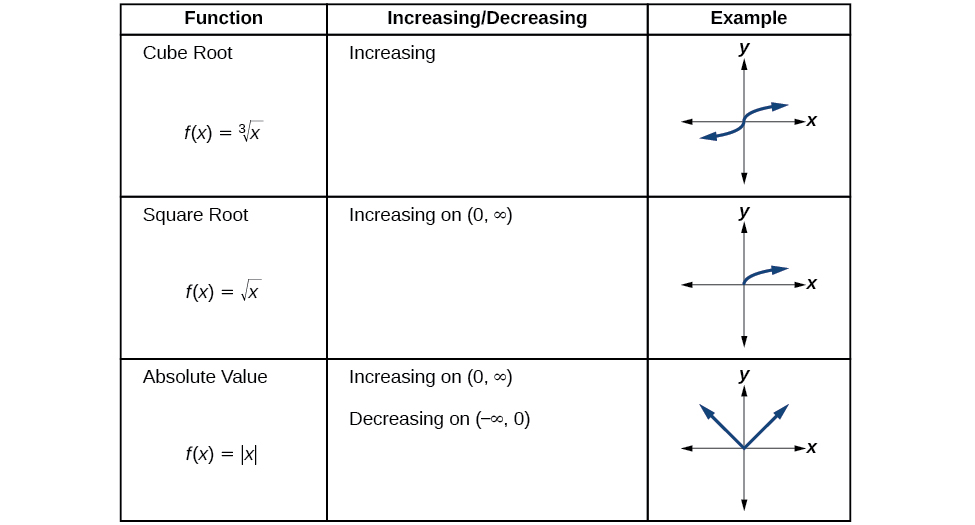
Analyzing the toolkit functions for increasing or decreasing intervals
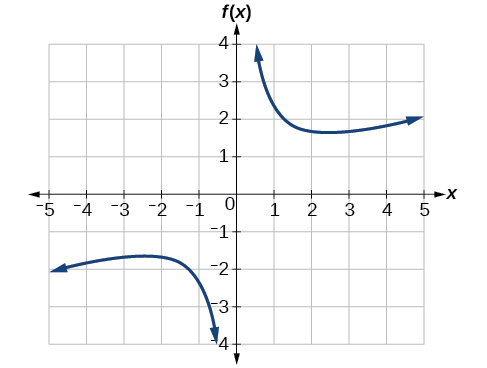
We will now return to our toolkit functions and discuss their graphical behavior in
[link] ,
[link] , and
[link] .
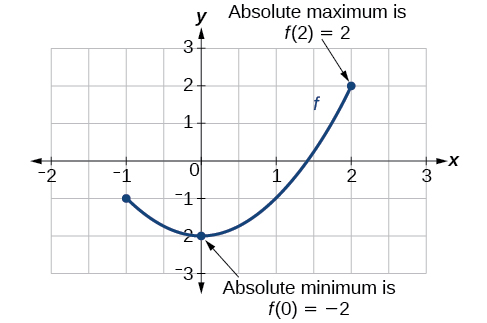
Use a graph to locate the absolute maximum and absolute minimum
There is a difference between locating the highest and lowest points on a graph in a region around an open interval (locally) and locating the highest and lowest points on the graph for the entire domain. The
coordinates (output) at the highest and lowest points are called the
absolute maximum and
absolute minimum , respectively.
To locate absolute maxima and minima from a graph, we need to observe the graph to determine where the graph attains it highest and lowest points on the domain of the function. See
[link] .
Not every function has an absolute maximum or minimum value. The toolkit function
is one such function.
Absolute maxima and minima
The
absolute maximum of
at
is
where
for all
in the domain of
The
absolute minimum of
at
is
where
for all
in the domain of
Finding absolute maxima and minima from a graph
For the function
shown in
[link] , find all absolute maxima and minima.
Observe the graph of
The graph attains an absolute maximum in two locations,
and
because at these locations, the graph attains its highest point on the domain of the function. The absolute maximum is the
y -coordinate at
and
which is
The graph attains an absolute minimum at
because it is the lowest point on the domain of the function’s graph. The absolute minimum is the
y -coordinate at
which is
Bacteria doesn't produce energy they are dependent upon their substrate in case of lack of nutrients they are able to make spores which helps them to sustain in harsh environments
_Adnan
But not all bacteria make spores, l mean Eukaryotic cells have Mitochondria which acts as powerhouse for them, since bacteria don't have it, what is the substitution for it?
Assimilatory nitrate reduction is a process that occurs in some microorganisms, such as bacteria and archaea, in which nitrate (NO3-) is reduced to nitrite (NO2-), and then further reduced to ammonia (NH3).
Elkana
This process is called assimilatory nitrate reduction because the nitrogen that is produced is incorporated in the cells of microorganisms where it can be used in the synthesis of amino acids and other nitrogen products
There are nothing like emergency disease but there are some common medical emergency which can occur simultaneously like Bleeding,heart attack,Breathing difficulties,severe pain heart stock.Hope you will get my point .Have a nice day ❣️
_Adnan
define infection ,prevention and control
Innocent
I think infection prevention and control is the avoidance of all things we do that gives out break of infections and promotion of health practices that promote life