We have explored a number of seemingly complex polar curves in this section.
[link] and
[link] summarize the graphs and equations for each of these curves.
Access these online resources for additional instruction and practice with graphs of polar coordinates.
It is easier to graph polar equations if we can test the equations for symmetry with respect to the line
the polar axis, or the pole.
There are three symmetry tests that indicate whether the graph of a polar equation will exhibit symmetry. If an equation fails a symmetry test, the graph may or may not exhibit symmetry. See
[link] .
Polar equations may be graphed by making a table of values for
and
The maximum value of a polar equation is found by substituting the value
that leads to the maximum value of the trigonometric expression.
The zeros of a polar equation are found by setting
and solving for
See
[link] .
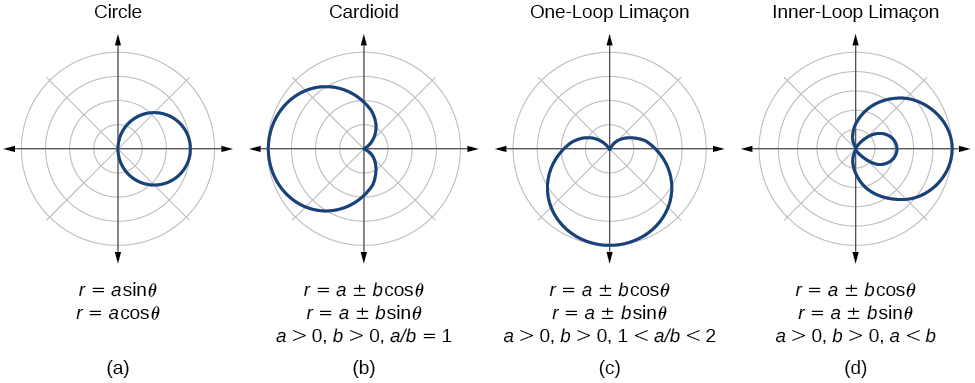
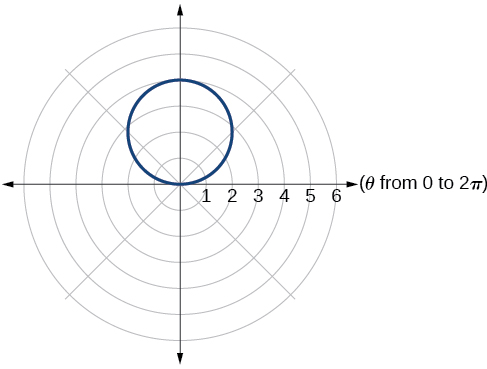
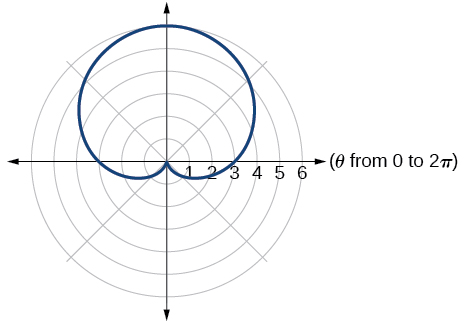
Some formulas that produce the graph of a circle in polar coordinates are given by
and
See
[link] .
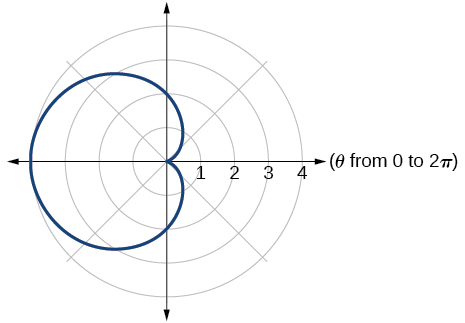
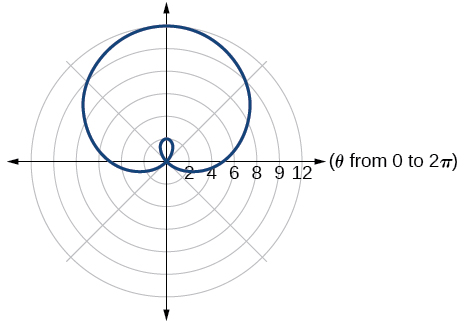
The formulas that produce the graphs of a cardioid are given by
and
for
and
See
[link] .
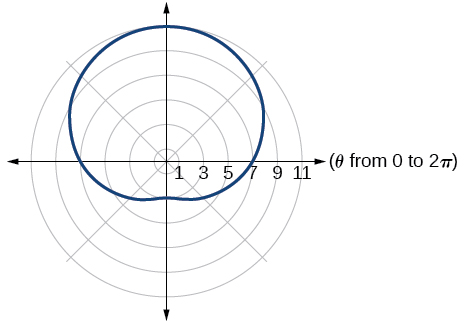
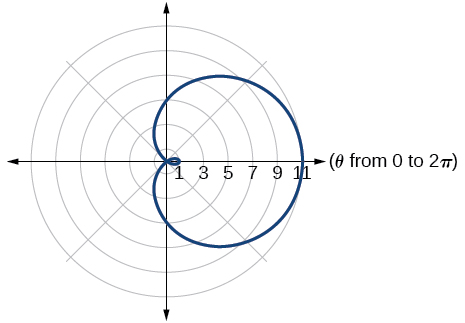
The formulas that produce the graphs of a one-loop limaçon are given by
and
for
See
[link] .
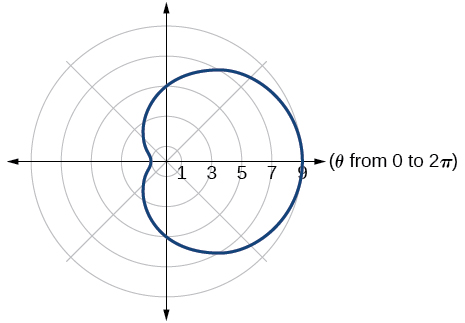
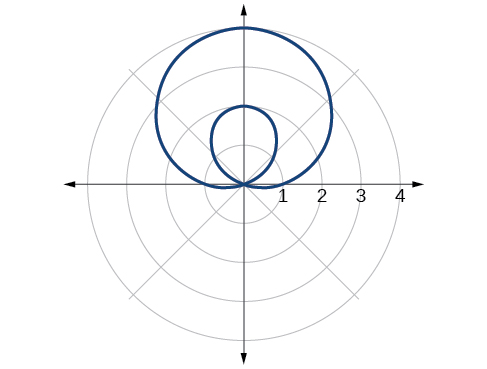
The formulas that produce the graphs of an inner-loop limaçon are given by
and
for
and
See
[link] .
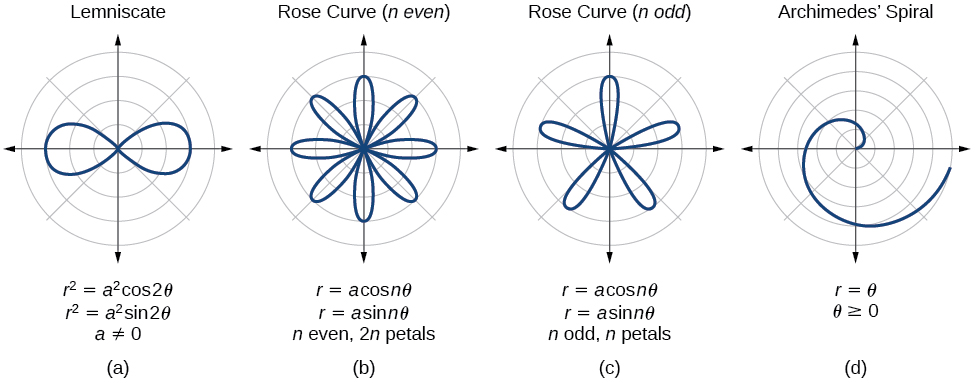
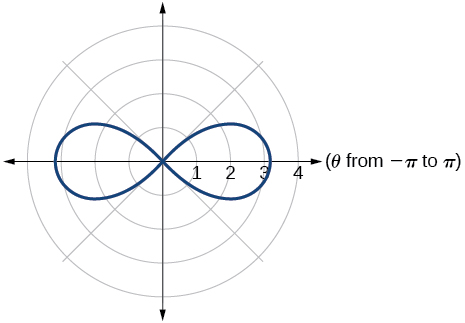
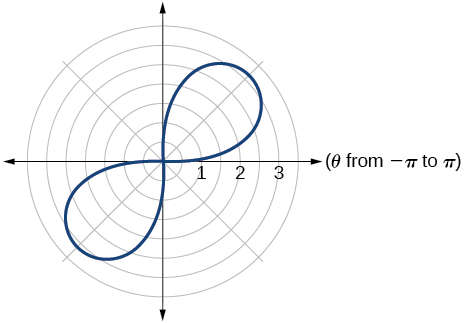
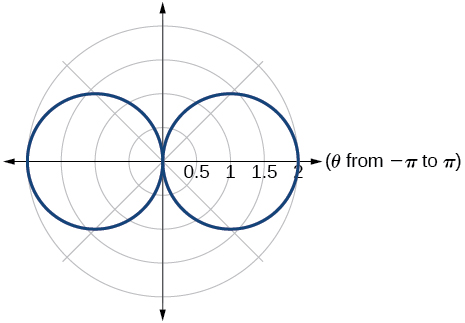
The formulas that produce the graphs of a lemniscates are given by
and
where
See
[link] .
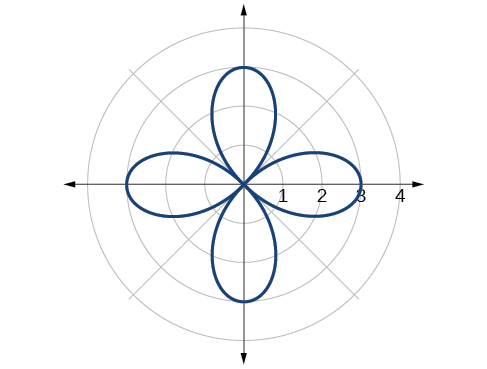
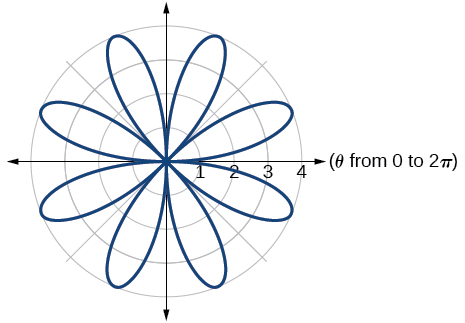
The formulas that produce the graphs of rose curves are given by
and
where
if
is even, there are
petals, and if
is odd, there are
petals. See
[link] and
[link] .
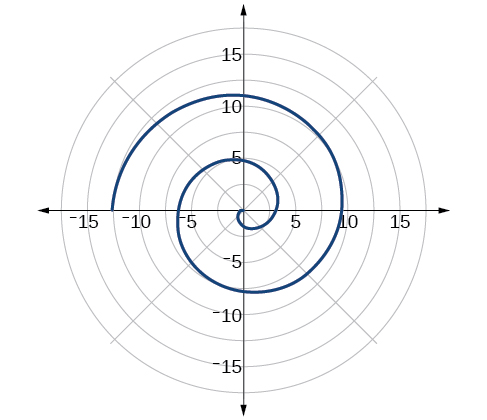
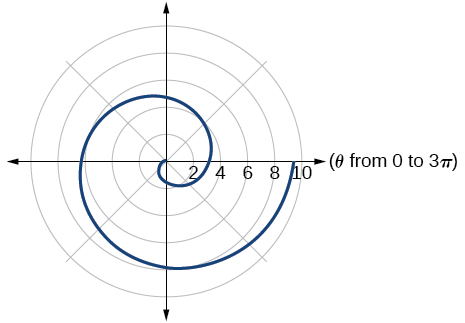
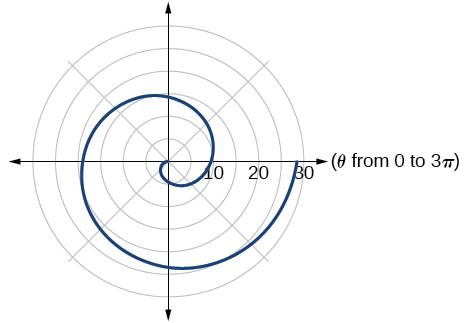
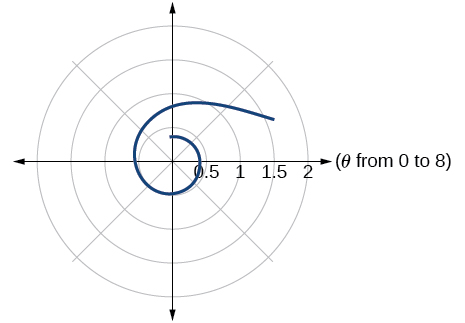
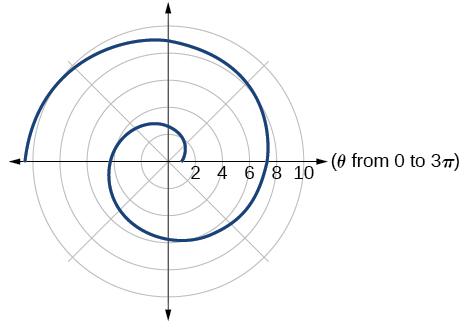
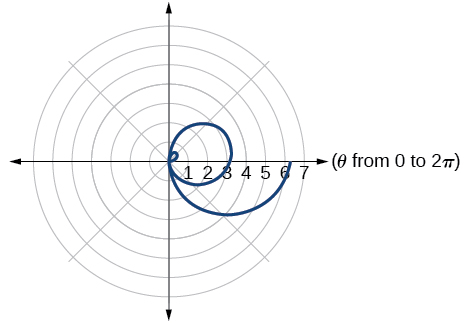
The formula that produces the graph of an Archimedes’ spiral is given by
See
[link] .
Section exercises
Verbal
Describe the three types of symmetry in polar graphs, and compare them to the symmetry of the Cartesian plane.
Symmetry with respect to the polar axis is similar to symmetry about the
-axis, symmetry with respect to the pole is similar to symmetry about the origin, and symmetric with respect to the line
is similar to symmetry about the
-axis.
What are the steps to follow when graphing polar equations?
Test for symmetry; find zeros, intercepts, and maxima; make a table of values. Decide the general type of graph, cardioid, limaçon, lemniscate, etc., then plot points at
and sketch the graph.
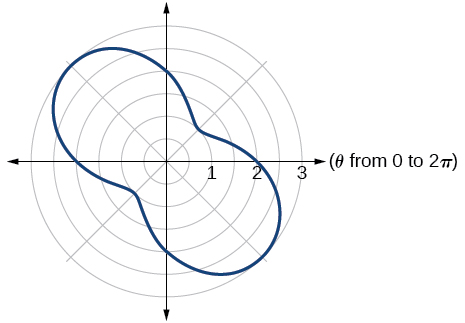
For the following exercises, use a graphing utility to graph each pair of polar equations on a domain of
and then explain the differences shown in the graphs.
Both graphs are curves with 2 loops. The equation with a coefficient of
has two loops on the left, the equation with a coefficient of 2 has two loops side by side. Graph these from 0 to
to get a better picture.
Bacteria doesn't produce energy they are dependent upon their substrate in case of lack of nutrients they are able to make spores which helps them to sustain in harsh environments
_Adnan
But not all bacteria make spores, l mean Eukaryotic cells have Mitochondria which acts as powerhouse for them, since bacteria don't have it, what is the substitution for it?
Assimilatory nitrate reduction is a process that occurs in some microorganisms, such as bacteria and archaea, in which nitrate (NO3-) is reduced to nitrite (NO2-), and then further reduced to ammonia (NH3).
Elkana
This process is called assimilatory nitrate reduction because the nitrogen that is produced is incorporated in the cells of microorganisms where it can be used in the synthesis of amino acids and other nitrogen products
There are nothing like emergency disease but there are some common medical emergency which can occur simultaneously like Bleeding,heart attack,Breathing difficulties,severe pain heart stock.Hope you will get my point .Have a nice day ❣️
_Adnan
define infection ,prevention and control
Innocent
I think infection prevention and control is the avoidance of all things we do that gives out break of infections and promotion of health practices that promote life