-
Home
- Algebra and trigonometry
- Functions
- Functions and function notation
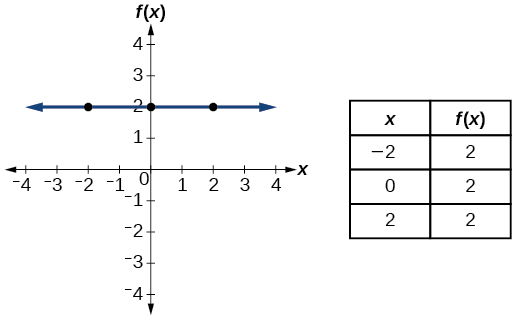
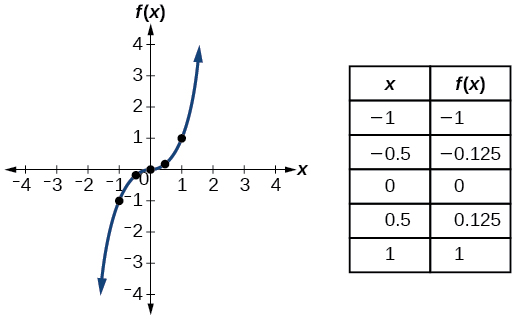
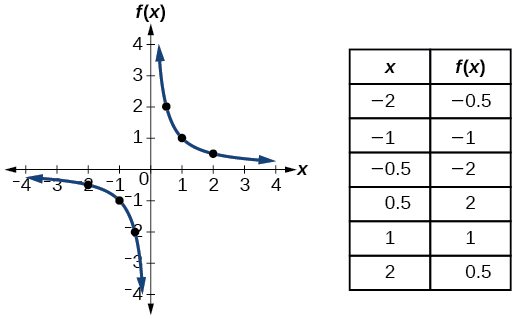
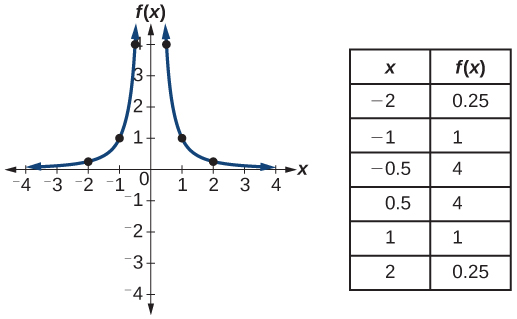
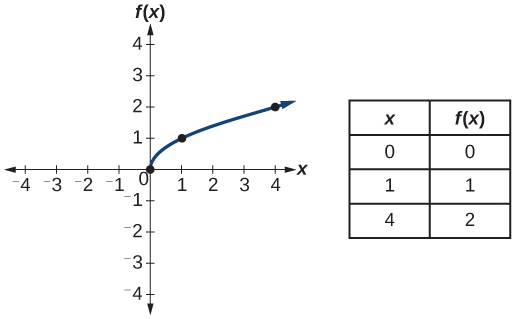
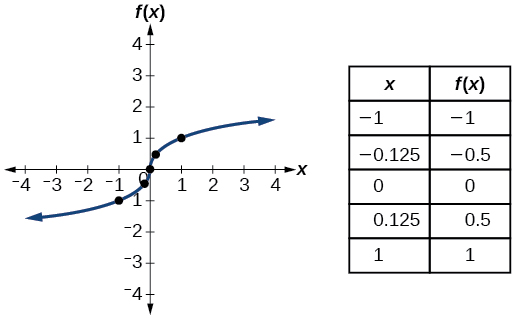
We will see these toolkit functions, combinations of toolkit functions, their graphs, and their transformations frequently throughout this book. It will be very helpful if we can recognize these toolkit functions and their features quickly by name, formula, graph, and basic table properties. The graphs and sample table values are included with each function shown in
[link] .
| Toolkit Functions |
| Name |
Function |
Graph |
| Constant |
where
is a constant |
 |
| Identity |
|
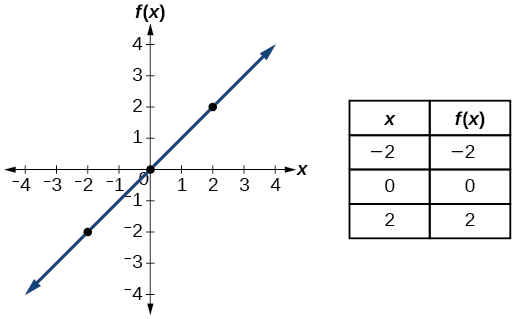 |
| Absolute value |
|
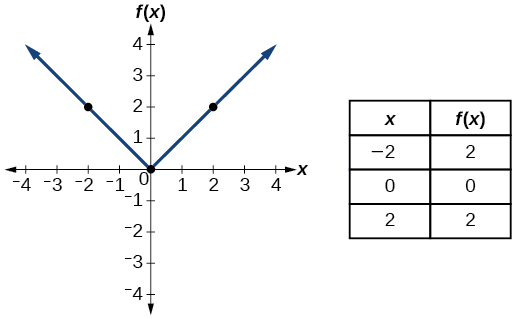 |
| Quadratic |
|
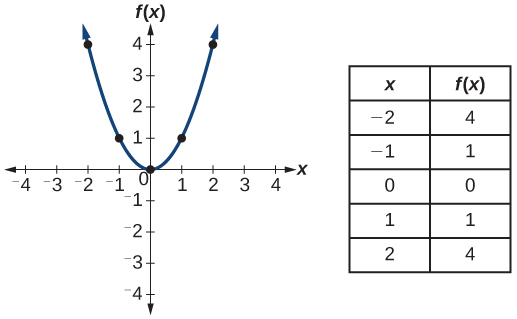 |
| Cubic |
|
 |
| Reciprocal |
|
 |
| Reciprocal squared |
|
 |
| Square root |
|
 |
| Cube root |
|
 |
Key equations
| Constant function |
where
is a constant |
| Identity function |
|
| Absolute value function |
|
| Quadratic function |
|
| Cubic function |
|
| Reciprocal function |
|
| Reciprocal squared function |
|
| Square root function |
|
| Cube root function |
|
Key concepts
- A relation is a set of ordered pairs. A function is a specific type of relation in which each domain value, or input, leads to exactly one range value, or output. See
[link] and
[link] .
- Function notation is a shorthand method for relating the input to the output in the form
See
[link] and
[link] .
- In tabular form, a function can be represented by rows or columns that relate to input and output values. See
[link] .
- To evaluate a function, we determine an output value for a corresponding input value. Algebraic forms of a function can be evaluated by replacing the input variable with a given value. See
[link] and
[link] .
- To solve for a specific function value, we determine the input values that yield the specific output value. See
[link] .
- An algebraic form of a function can be written from an equation. See
[link] and
[link] .
- Input and output values of a function can be identified from a table. See
[link] .
- Relating input values to output values on a graph is another way to evaluate a function. See
[link] .
- A function is one-to-one if each output value corresponds to only one input value. See
[link] .
- A graph represents a function if any vertical line drawn on the graph intersects the graph at no more than one point. See
[link] .
- The graph of a one-to-one function passes the horizontal line test. See
[link] .
Section exercises
Verbal
What is the difference between a relation and a function?
A relation is a set of ordered pairs. A function is a special kind of relation in which no two ordered pairs have the same first coordinate.
Got questions? Get instant answers now!
Why does the vertical line test tell us whether the graph of a relation represents a function?
When a vertical line intersects the graph of a relation more than once, that indicates that for that input there is more than one output. At any particular input value, there can be only one output if the relation is to be a function.
Got questions? Get instant answers now!
Questions & Answers
differentiate between demand and supply
giving examples
differentiated between demand and supply using examples
Lambiv
how is the graph works?I don't fully understand
hi guys good evening to all
Lambiv
In economics, a perfect market refers to a theoretical construct where all participants have perfect information, goods are homogenous, there are no barriers to entry or exit, and prices are determined solely by supply and demand. It's an idealized model used for analysis,
Ezea
other things being equal
AI-Robot
When MP₁ becomes negative, TP start to decline.
Extuples Suppose that the short-run production function of certain cut-flower firm is given by: Q=4KL-0.6K2 - 0.112 •
Where is quantity of cut flower produced, I is labour input and K is fixed capital input (K-5). Determine the average product of lab
Kelo
Extuples Suppose that the short-run production function of certain cut-flower firm is given by: Q=4KL-0.6K2 - 0.112 •
Where is quantity of cut flower produced, I is labour input and K is fixed capital input (K-5). Determine the average product of labour (APL) and marginal product of labour (MPL)
Kelo
Can I ask you other question?
Shukri
What is different between quantity demand and demand?
Quantity demanded refers to the specific amount of a good or service that consumers are willing and able to purchase at a give price and within a specific time period. Demand, on the other hand, is a broader concept that encompasses the entire relationship between price and quantity demanded
Ezea
how do you save a country economic situation when it's falling apart
what is the difference between economic growth and development
Economic growth as an increase in the production and consumption of goods and services within an economy.but
Economic development as a broader concept that encompasses not only economic growth but also social & human well being.
Shukri
production function means
Jabir
What do you think is more important to focus on when considering inequality ?
any question about economics?
sir...I just want to ask one question... Define the term contract curve? if you are free please help me to find this answer 🙏
Asui
it is a curve that we get after connecting the pareto optimal combinations of two consumers after their mutually beneficial trade offs
Awais
thank you so much 👍 sir
Asui
In economics, the contract curve refers to the set of points in an Edgeworth box diagram where both parties involved in a trade cannot be made better off without making one of them worse off. It represents the Pareto efficient allocations of goods between two individuals or entities, where neither p
Cornelius
In economics, the contract curve refers to the set of points in an Edgeworth box diagram where both parties involved in a trade cannot be made better off without making one of them worse off. It represents the Pareto efficient allocations of goods between two individuals or entities,
Cornelius
Suppose a consumer consuming two commodities X and Y has
The following utility function u=X0.4 Y0.6. If the price of the X and Y are 2 and 3 respectively and income Constraint is birr 50.
A,Calculate quantities of x and y which maximize utility.
B,Calculate value of Lagrange multiplier.
C,Calculate quantities of X and Y consumed with a given price.
D,alculate optimum level of output .
the market for lemon has 10 potential consumers, each having an individual demand curve p=101-10Qi, where p is price in dollar's per cup and Qi is the number of cups demanded per week by the i th consumer.Find the market demand curve using algebra. Draw an individual demand curve and the market dema
suppose the production function is given by ( L, K)=L¼K¾.assuming capital is fixed find APL and MPL. consider the following short run production function:Q=6L²-0.4L³ a) find the value of L that maximizes output b)find the value of L that maximizes marginal product
Abdureman
What is the difference between perfect competition and monopolistic competition?
Mohammed
Got questions? Join the online conversation and get instant answers!
Source:
OpenStax, Algebra and trigonometry. OpenStax CNX. Nov 14, 2016 Download for free at https://legacy.cnx.org/content/col11758/1.6
Google Play and the Google Play logo are trademarks of Google Inc.


