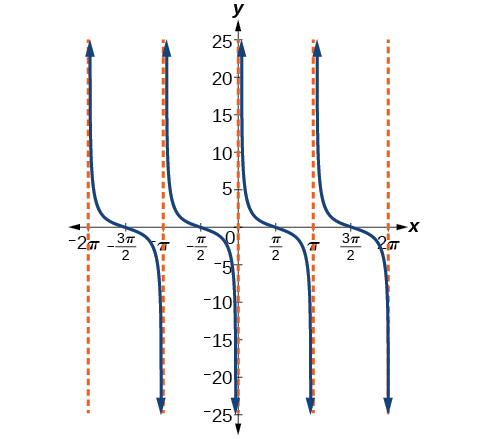
The cotangent graph has vertical asymptotes at each value of
where
we show these in the graph below with dashed lines. Since the cotangent is the reciprocal of the tangent,
has vertical asymptotes at all values of
where
and
at all values of
where
has its vertical asymptotes.
The cotangent function
Features of the graph of
y =
A Cot(
Bx )
The stretching factor is
The period is
The domain is
where
is an integer.
The range is
The asymptotes occur at
where
is an integer.
is an odd function.
Graphing variations of
y = cot
x
We can transform the graph of the cotangent in much the same way as we did for the tangent. The equation becomes the following.
Properties of the graph of
y =
A Cot(
Bx −c)+
D
The stretching factor is
The period is
The domain is
where
is an integer.
The range is
The vertical asymptotes occur at
where
is an integer.
There is no amplitude.
is an odd function because it is the quotient of even and odd functions (cosine and sine, respectively)
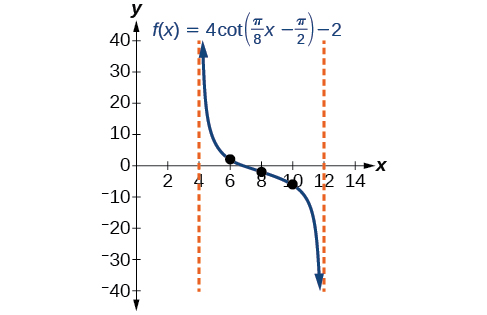
Given a modified cotangent function of the form
graph one period.
Express the function in the form
Identify the stretching factor,
Identify the period,
Draw the graph of
Plot any two reference points.
Use the reciprocal relationship between tangent and cotangent to draw the graph of
Sketch the asymptotes.
Graphing variations of the cotangent function
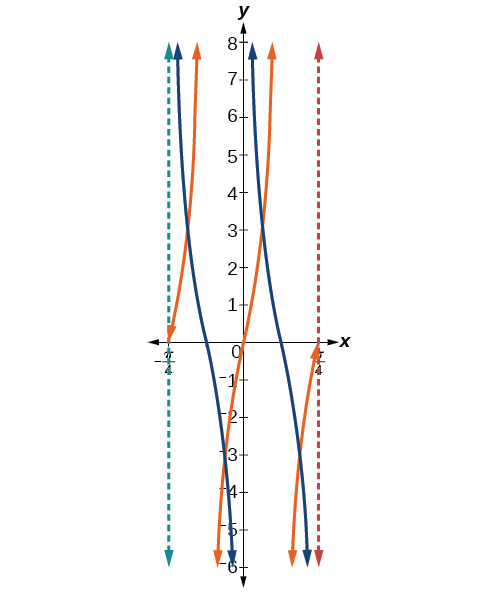
Determine the stretching factor, period, and phase shift of
and then sketch a graph.
Step 1. Expressing the function in the form
gives
Step 2. The stretching factor is
Step 3. The period is
Step 4. Sketch the graph of
Step 5. Plot two reference points. Two such points are
and
Step 6. Use the reciprocal relationship to draw
Step 7. Sketch the asymptotes,
The orange graph in
[link] shows
and the blue graph shows
what's the difference between a firm and an industry
Abdul
firm is the unit which transform inputs to output where as industry contain combination of firms with similar production 😅😅
Abdulraufu
Suppose the demand function that a firm faces shifted from
Qd 120 3P
to
Qd 90 3P
and the supply function has shifted from
QS
20 2P
to
QS
10 2P .
a) Find the effect of this change on price and quantity.
b) Which of the changes in demand and supply is higher?
Demand curve shows that how supply and others conditions affect on demand of a particular thing and what percent demand increase whith increase of supply of goods
Israr
Hi Sir please how do u calculate Cross elastic demand and income elastic demand?
Abari
Got questions? Join the online conversation and get instant answers!