| << Chapter < Page | Chapter >> Page > |

White light, such as the light from the sun, is not actually white at all. Instead, it is a composition of all the colors of the rainbow in the form of waves. The individual colors can be seen only when white light passes through an optical prism that separates the waves according to their wavelengths to form a rainbow.
Light waves can be represented graphically by the sine function. In the chapter on Trigonometric Functions , we examined trigonometric functions such as the sine function. In this section, we will interpret and create graphs of sine and cosine functions.
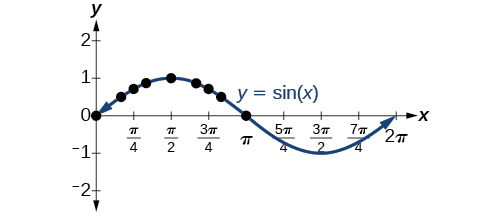
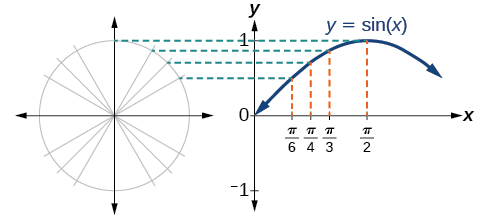
Recall that the sine and cosine functions relate real number values to the x - and y -coordinates of a point on the unit circle. So what do they look like on a graph on a coordinate plane? Let’s start with the sine function . We can create a table of values and use them to sketch a graph. [link] lists some of the values for the sine function on a unit circle.
Plotting the points from the table and continuing along the x -axis gives the shape of the sine function. See [link] .

Notice how the sine values are positive between 0 and which correspond to the values of the sine function in quadrants I and II on the unit circle, and the sine values are negative between and which correspond to the values of the sine function in quadrants III and IV on the unit circle. See [link] .

Now let’s take a similar look at the cosine function . Again, we can create a table of values and use them to sketch a graph. [link] lists some of the values for the cosine function on a unit circle.
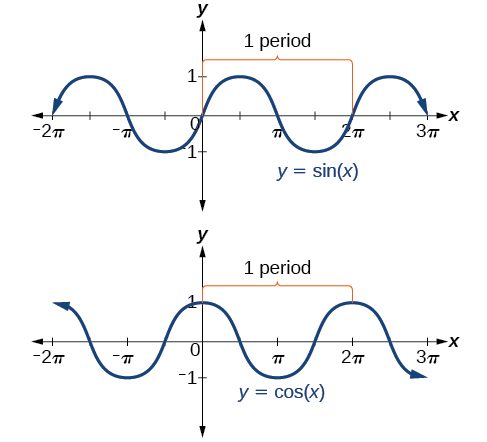
As with the sine function, we can plots points to create a graph of the cosine function as in [link] .

Because we can evaluate the sine and cosine of any real number, both of these functions are defined for all real numbers. By thinking of the sine and cosine values as coordinates of points on a unit circle, it becomes clear that the range of both functions must be the interval
In both graphs, the shape of the graph repeats after which means the functions are periodic with a period of A periodic function is a function for which a specific horizontal shift , P , results in a function equal to the original function: for all values of in the domain of When this occurs, we call the smallest such horizontal shift with the period of the function. [link] shows several periods of the sine and cosine functions.

Looking again at the sine and cosine functions on a domain centered at the y -axis helps reveal symmetries. As we can see in [link] , the sine function is symmetric about the origin. Recall from The Other Trigonometric Functions that we determined from the unit circle that the sine function is an odd function because Now we can clearly see this property from the graph.

Notification Switch
Would you like to follow the 'Algebra and trigonometry' conversation and receive update notifications?