Graph plane curves described by parametric equations by plotting points.
Graph parametric equations.
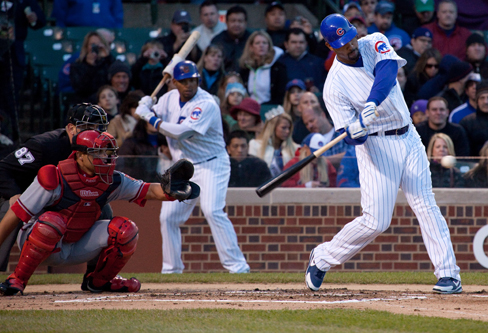
It is the bottom of the ninth inning, with two outs and two men on base. The home team is losing by two runs. The batter swings and hits the baseball at 140 feet per second and at an angle of approximately
to the horizontal. How far will the ball travel? Will it clear the fence for a game-winning home run? The outcome may depend partly on other factors (for example, the wind), but mathematicians can model the path of a projectile and predict approximately how far it will travel using
parametric equations . In this section, we’ll discuss parametric equations and some common applications, such as projectile motion problems.
Parametric equations can model the path of a projectile. (credit: Paul Kreher, Flickr)
Graphing parametric equations by plotting points
In lieu of a graphing calculator or a computer graphing program, plotting points to represent the graph of an equation is the standard method. As long as we are careful in calculating the values, point-plotting is highly dependable.
Given a pair of parametric equations, sketch a graph by plotting points.
Construct a table with three columns:
Evaluate
and
for values of
over the interval for which the functions are defined.
Plot the resulting pairs
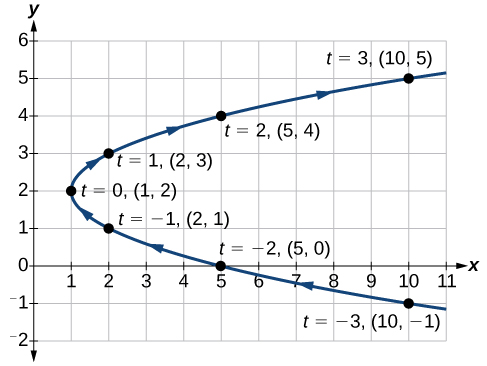
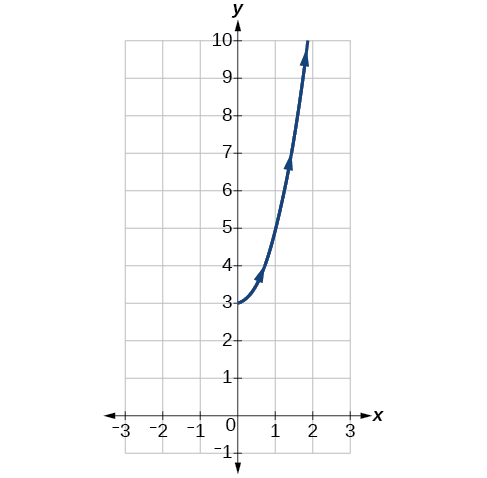
Sketching the graph of a pair of parametric equations by plotting points
Sketch the graph of the
parametric equations
Construct a table of values for
and
as in
[link] , and plot the points in a plane.
The graph is a
parabola with vertex at the point
opening to the right. See
[link] .
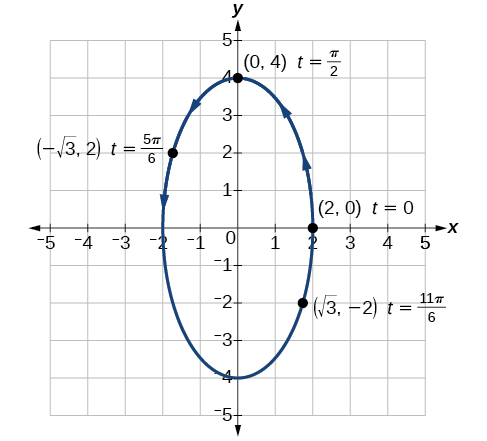
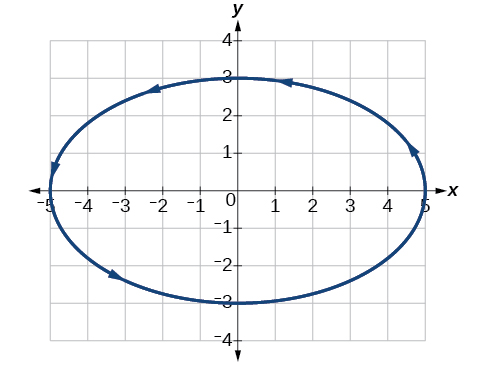
Sketching the graph of trigonometric parametric equations
Construct a table of values for the given parametric equations and sketch the graph:
Construct a table like that in
[link] using angle measure in radians as inputs for
and evaluating
and
Using angles with known sine and cosine values for
makes calculations easier.
By the symmetry shown in the values of
and
we see that the parametric equations represent an
ellipse . The
ellipse is mapped in a counterclockwise direction as shown by the arrows indicating increasing
values.
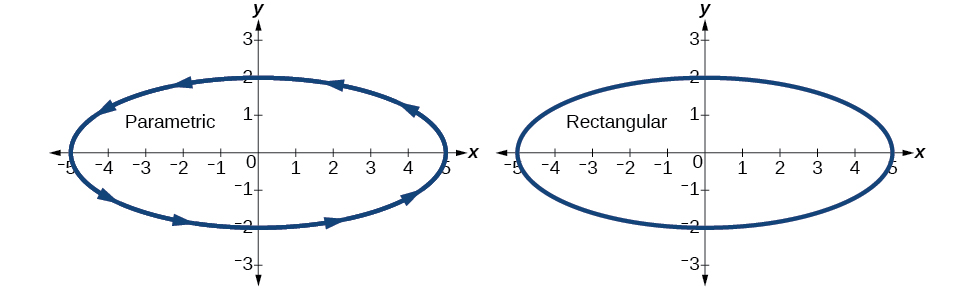
Graphing parametric equations and rectangular form together
Graph the parametric equations
and
First, construct the graph using data points generated from the
parametric form . Then graph the
rectangular form of the equation. Compare the two graphs.
Next, translate the parametric equations to rectangular form. To do this, we solve for
in either
or
and then substitute the expression for
in the other equation. The result will be a function
if solving for
as a function of
or
if solving for
as a function of
The lymphatic system plays several crucial roles in the human body, functioning as a key component of the immune system and contributing to the maintenance of fluid balance. Its main functions include:
1. Immune Response: The lymphatic system produces and transports lymphocytes, which are a type of
asegid
to transport fluids fats proteins and lymphocytes to the blood stream as lymph
Anatomy is the study of the structure of the body, while physiology is the study of the function of the body. Anatomy looks at the body's organs and systems, while physiology looks at how those organs and systems work together to keep the body functioning.
Enzymes are proteins that help speed up chemical reactions in our bodies. Enzymes are essential for digestion, liver function and much more. Too much or too little of a certain enzyme can cause health problems
Kamara
yes
Prince
how does the stomach protect itself from the damaging effects of HCl
the normal temperature is 37°c or 98.6 °Fahrenheit is important for maintaining the homeostasis in the body
the body regular this temperature through the process called thermoregulation which involves brain skin muscle and other organ working together to maintain stable internal temperature