Given a function and both a vertical and a horizontal shift, sketch the graph.
Identify the vertical and horizontal shifts from the formula.
The vertical shift results from a constant added to the output. Move the graph up for a positive constant and down for a negative constant.
The horizontal shift results from a constant added to the input. Move the graph left for a positive constant and right for a negative constant.
Apply the shifts to the graph in either order.
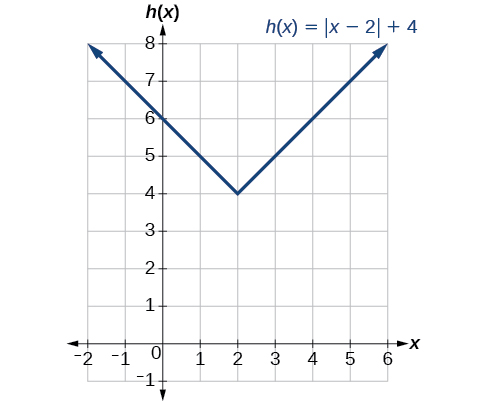
Graphing combined vertical and horizontal shifts
Given
sketch a graph of
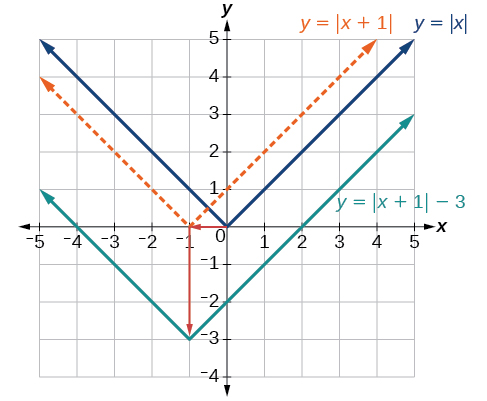
The function
is our toolkit absolute value function. We know that this graph has a V shape, with the point at the origin. The graph of
has transformed
in two ways:
is a change on the inside of the function, giving a horizontal shift left by 1, and the subtraction by 3 in
is a change to the outside of the function, giving a vertical shift down by 3. The transformation of the graph is illustrated in
[link] .
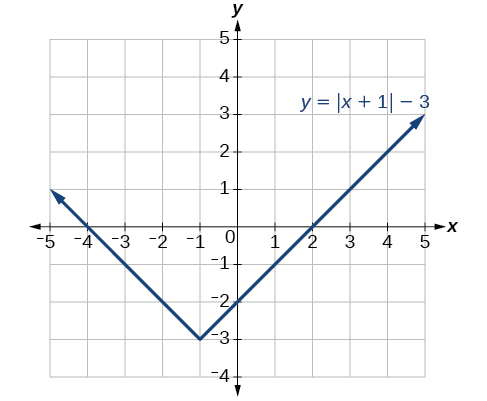
Let us follow one point of the graph of
The point
is transformed first by shifting left 1 unit:
The point
is transformed next by shifting down 3 units:
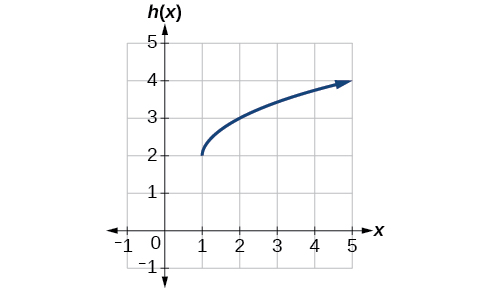
Identifying combined vertical and horizontal shifts
Write a formula for the graph shown in
[link] , which is a transformation of the toolkit square root function.
The graph of the toolkit function starts at the origin, so this graph has been shifted 1 to the right and up 2. In function notation, we could write that as
Using the formula for the square root function, we can write
Graphing functions using reflections about the axes
Another transformation that can be applied to a function is a reflection over the
x - or
y -axis. A
vertical reflection reflects a graph vertically across the
x -axis, while a
horizontal reflection reflects a graph horizontally across the
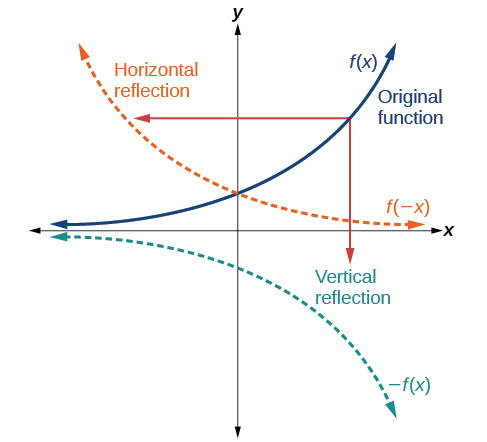
y -axis. The reflections are shown in
[link] .
Vertical and horizontal reflections of a function.
Notice that the vertical reflection produces a new graph that is a mirror image of the base or original graph about the
x -axis. The horizontal reflection produces a new graph that is a mirror image of the base or original graph about the
y -axis.
Reflections
Given a function
a new function
is a
vertical reflection of the function
sometimes called a reflection about (or over, or through) the
x -axis.
Given a function
a new function
is a
horizontal reflection of the function
sometimes called a reflection about the
y -axis.
Given a function, reflect the graph both vertically and horizontally.
Multiply all outputs by –1 for a vertical reflection. The new graph is a reflection of the original graph about the
x -axis.
Multiply all inputs by –1 for a horizontal reflection. The new graph is a reflection of the original graph about the
y -axis.
Abiotic factors are non living components of ecosystem.These include physical and chemical elements like temperature,light,water,soil,air quality and oxygen etc