Given a function and both a vertical and a horizontal shift, sketch the graph.
Identify the vertical and horizontal shifts from the formula.
The vertical shift results from a constant added to the output. Move the graph up for a positive constant and down for a negative constant.
The horizontal shift results from a constant added to the input. Move the graph left for a positive constant and right for a negative constant.
Apply the shifts to the graph in either order.
Graphing combined vertical and horizontal shifts
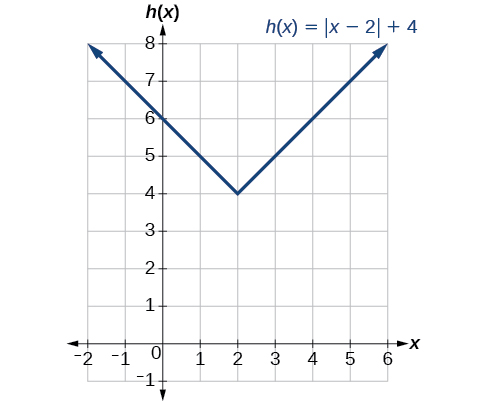
Given
sketch a graph of
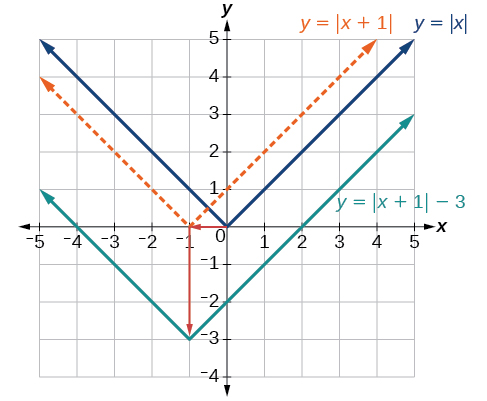
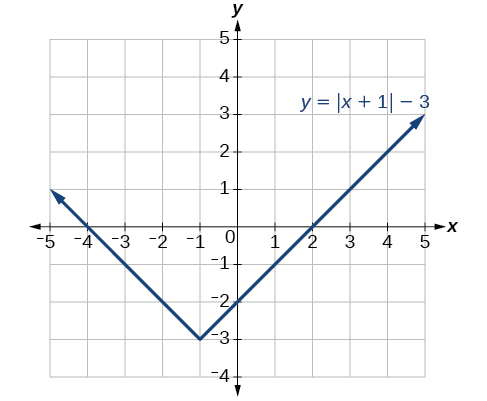
The function
is our toolkit absolute value function. We know that this graph has a V shape, with the point at the origin. The graph of
has transformed
in two ways:
is a change on the inside of the function, giving a horizontal shift left by 1, and the subtraction by 3 in
is a change to the outside of the function, giving a vertical shift down by 3. The transformation of the graph is illustrated in
[link] .
Let us follow one point of the graph of
The point
is transformed first by shifting left 1 unit:
The point
is transformed next by shifting down 3 units:
Identifying combined vertical and horizontal shifts
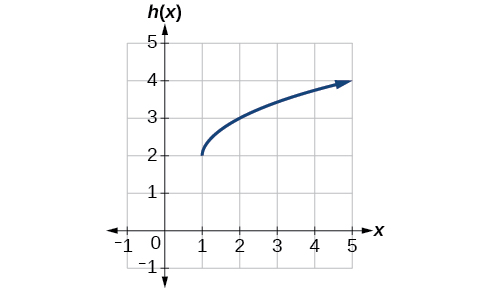
Write a formula for the graph shown in
[link] , which is a transformation of the toolkit square root function.
The graph of the toolkit function starts at the origin, so this graph has been shifted 1 to the right and up 2. In function notation, we could write that as
Using the formula for the square root function, we can write
Graphing functions using reflections about the axes
Another transformation that can be applied to a function is a reflection over the
x - or
y -axis. A
vertical reflection reflects a graph vertically across the
x -axis, while a
horizontal reflection reflects a graph horizontally across the
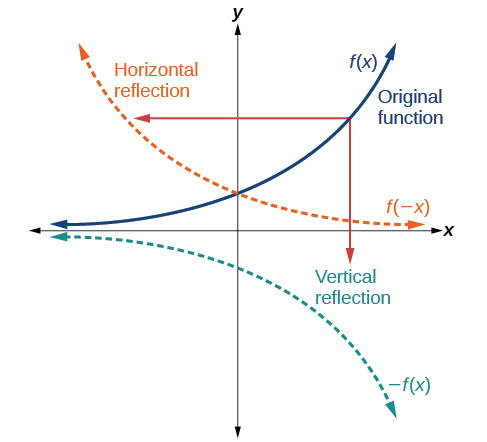
y -axis. The reflections are shown in
[link] .
Vertical and horizontal reflections of a function.
Notice that the vertical reflection produces a new graph that is a mirror image of the base or original graph about the
x -axis. The horizontal reflection produces a new graph that is a mirror image of the base or original graph about the
y -axis.
Reflections
Given a function
a new function
is a
vertical reflection of the function
sometimes called a reflection about (or over, or through) the
x -axis.
Given a function
a new function
is a
horizontal reflection of the function
sometimes called a reflection about the
y -axis.
Given a function, reflect the graph both vertically and horizontally.
Multiply all outputs by –1 for a vertical reflection. The new graph is a reflection of the original graph about the
x -axis.
Multiply all inputs by –1 for a horizontal reflection. The new graph is a reflection of the original graph about the
y -axis.
Questions & Answers
A golfer on a fairway is 70 m away from the green, which sits below the level of the fairway by 20 m. If the golfer hits the ball at an angle of 40° with an initial speed of 20 m/s, how close to the green does she come?
A mouse of mass 200 g falls 100 m down a vertical mine shaft and lands at the bottom with a speed of 8.0 m/s. During its fall, how much work is done on the mouse by air resistance
Chemistry is a branch of science that deals with the study of matter,it composition,it structure and the changes it undergoes
Adjei
please, I'm a physics student and I need help in physics
Adjanou
chemistry could also be understood like the sexual attraction/repulsion of the male and female elements. the reaction varies depending on the energy differences of each given gender. + masculine -female.
Pedro
A ball is thrown straight up.it passes a 2.0m high window 7.50 m off the ground on it path up and takes 1.30 s to go past the window.what was the ball initial velocity
2. A sled plus passenger with total mass 50 kg is pulled 20 m across the snow (0.20) at constant velocity by a force directed 25° above the horizontal. Calculate (a) the work of the applied force, (b) the work of friction, and (c) the total work.
you have been hired as an espert witness in a court case involving an automobile accident. the accident involved car A of mass 1500kg which crashed into stationary car B of mass 1100kg. the driver of car A applied his brakes 15 m before he skidded and crashed into car B. after the collision, car A s
can someone explain to me, an ignorant high school student, why the trend of the graph doesn't follow the fact that the higher frequency a sound wave is, the more power it is, hence, making me think the phons output would follow this general trend?
Nevermind i just realied that the graph is the phons output for a person with normal hearing and not just the phons output of the sound waves power, I should read the entire thing next time
Joseph
Follow up question, does anyone know where I can find a graph that accuretly depicts the actual relative "power" output of sound over its frequency instead of just humans hearing
Joseph
"Generation of electrical energy from sound energy | IEEE Conference Publication | IEEE Xplore" ***ieeexplore.ieee.org/document/7150687?reload=true
A string is 3.00 m long with a mass of 5.00 g. The string is held taut with a tension of 500.00 N applied to the string. A pulse is sent down the string. How long does it take the pulse to travel the 3.00 m of the string?