Given a function and both a vertical and a horizontal shift, sketch the graph.
Identify the vertical and horizontal shifts from the formula.
The vertical shift results from a constant added to the output. Move the graph up for a positive constant and down for a negative constant.
The horizontal shift results from a constant added to the input. Move the graph left for a positive constant and right for a negative constant.
Apply the shifts to the graph in either order.
Graphing combined vertical and horizontal shifts
Given
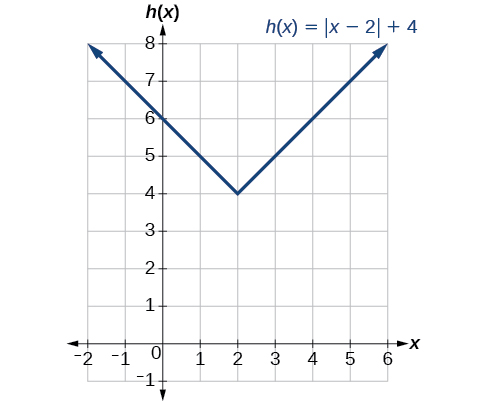
sketch a graph of
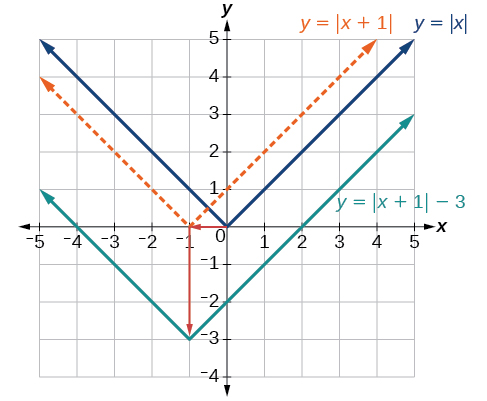
The function
is our toolkit absolute value function. We know that this graph has a V shape, with the point at the origin. The graph of
has transformed
in two ways:
is a change on the inside of the function, giving a horizontal shift left by 1, and the subtraction by 3 in
is a change to the outside of the function, giving a vertical shift down by 3. The transformation of the graph is illustrated in
[link] .
Let us follow one point of the graph of
The point
is transformed first by shifting left 1 unit:
The point
is transformed next by shifting down 3 units:
Identifying combined vertical and horizontal shifts
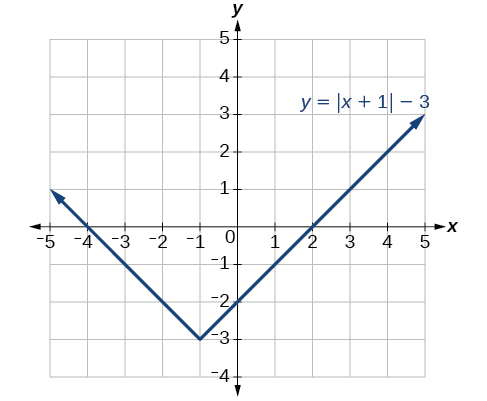
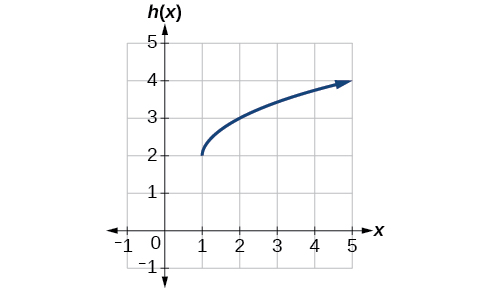
Write a formula for the graph shown in
[link] , which is a transformation of the toolkit square root function.
The graph of the toolkit function starts at the origin, so this graph has been shifted 1 to the right and up 2. In function notation, we could write that as
Using the formula for the square root function, we can write
Graphing functions using reflections about the axes
Another transformation that can be applied to a function is a reflection over the
x - or
y -axis. A
vertical reflection reflects a graph vertically across the
x -axis, while a
horizontal reflection reflects a graph horizontally across the
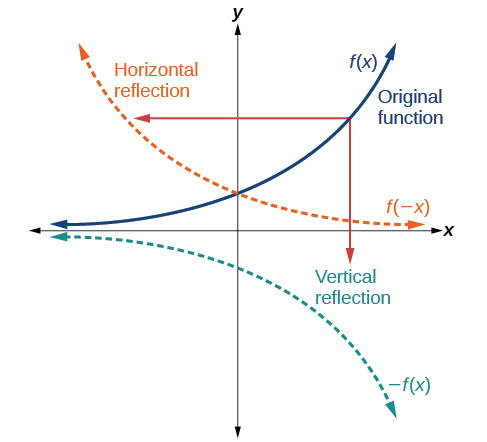
y -axis. The reflections are shown in
[link] .
Vertical and horizontal reflections of a function.
Notice that the vertical reflection produces a new graph that is a mirror image of the base or original graph about the
x -axis. The horizontal reflection produces a new graph that is a mirror image of the base or original graph about the
y -axis.
Reflections
Given a function
a new function
is a
vertical reflection of the function
sometimes called a reflection about (or over, or through) the
x -axis.
Given a function
a new function
is a
horizontal reflection of the function
sometimes called a reflection about the
y -axis.
Given a function, reflect the graph both vertically and horizontally.
Multiply all outputs by –1 for a vertical reflection. The new graph is a reflection of the original graph about the
x -axis.
Multiply all inputs by –1 for a horizontal reflection. The new graph is a reflection of the original graph about the
y -axis.
is it possible to leave every good at the same level
Joseph
I don't think so. because check it, if the demand for chicken increases, people will no longer consume fish like they used to causing a fall in the demand for fish
Anuolu
is not really possible to let the value of a goods to be same at the same time.....
Salome
Suppose the inflation rate is 6%, does it mean that all the goods you purchase will cost
6% more than previous year? Provide with reasoning.
Not necessarily. To measure the inflation rate economists normally use an averaged price index of a basket of certain goods. So if you purchase goods included in the basket, you will notice that you pay 6% more, otherwise not necessarily.
Good day
How do I calculate this question: C= 100+5yd G= 2000 T= 2000 I(planned)=200.
Suppose the actual output is 3000. What is the level of planned expenditures at this level of output?
I am Camara from Guinea west Africa... happy to meet you guys here
Sekou
ma management ho
Amisha
ahile becheclor ho
Amisha
hjr ktm bta ho
ani k kaam grnu hunxa tw
Amisha
belatari
Amisha
1st year ho
Amisha
nd u
Amisha
ahh
Amisha
kaha biratnagar
Amisha
ys
Amisha
kina k vo
Amisha
money as unit of account means what?
Kalombe
A unit of account is something that can be used to value goods and services and make calculations
Jim
all of you please speak in English I can't understand you're language
Muhammad
I want to know how can we define macroeconomics in one line
Muhammad
it must be .9 or 0.9
no Mpc is greater than 1
Y=100+.9Y+50
Y-.9Y=150
0.1Y/0.1=150/0.1
Y=1500
Kalombe
Mercy is it clear?😋
Kalombe
hi can someone help me on this question
If a negative shocks shifts the IS curve to the left, what type of policy do you suggest so as to stabilize the level of output?
discuss your answer using appropriate graph.