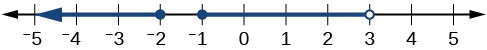
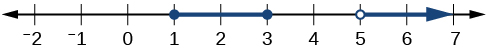
Describe the intervals of values shown in
[link] using inequality notation, set-builder notation, and interval notation.
To describe the values,
included in the intervals shown, we would say, “
is a real number greater than or equal to 1 and less than or equal to 3, or a real number greater than 5.”
Inequality
Set-builder notation
Interval notation
Remember that, when writing or reading interval notation, using a square bracket means the boundary is included in the set. Using a parenthesis means the boundary is not included in the set.
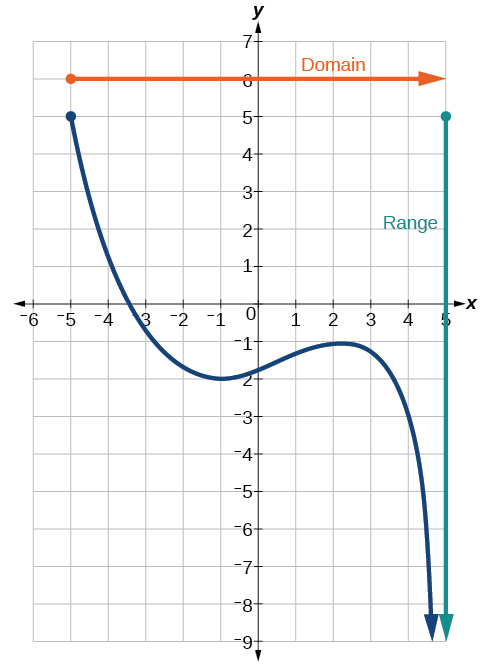
Another way to identify the domain and range of functions is by using graphs. Because the domain refers to the set of possible input values, the domain of a graph consists of all the input values shown on the
x -axis. The range is the set of possible output values, which are shown on the
y -axis. Keep in mind that if the graph continues beyond the portion of the graph we can see, the domain and range may be greater than the visible values. See
[link] .
We can observe that the graph extends horizontally from
to the right without bound, so the domain is
The vertical extent of the graph is all range values
and below, so the range is
Note that the domain and range are always written from smaller to larger values, or from left to right for domain, and from the bottom of the graph to the top of the graph for range.
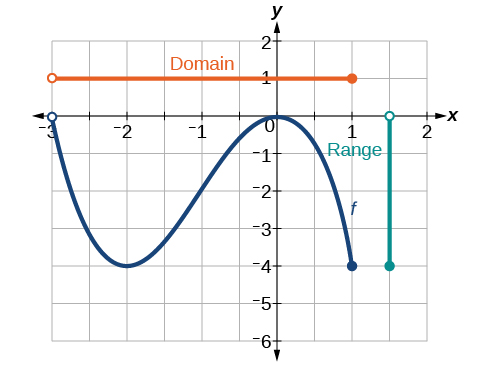
Finding domain and range from a graph
Find the domain and range of the function
whose graph is shown in
[link] .
We can observe that the horizontal extent of the graph is –3 to 1, so the domain of
is
The vertical extent of the graph is 0 to –4, so the range is
See
[link] .
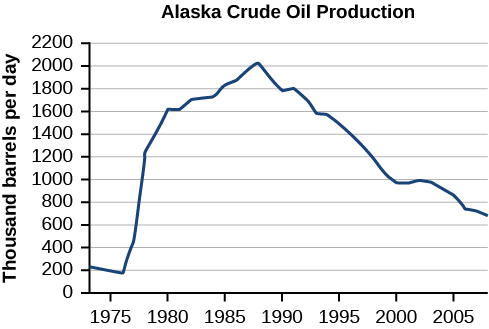
Finding domain and range from a graph of oil production
Find the domain and range of the function
whose graph is shown in
[link] .
(credit: modification of work by the U.S. Energy Information Administration)
http://www.eia.gov/dnav/pet/hist/LeafHandler.ashx?n=PET&s=MCRFPAK2&f=A.
The input quantity along the horizontal axis is “years,” which we represent with the variable
for time. The output quantity is “thousands of barrels of oil per day,” which we represent with the variable
for barrels. The graph may continue to the left and right beyond what is viewed, but based on the portion of the graph that is visible, we can determine the domain as
and the range as approximately
In interval notation, the domain is [1973, 2008], and the range is about [180, 2010]. For the domain and the range, we approximate the smallest and largest values since they do not fall exactly on the grid lines.
In economics, a perfect market refers to a theoretical construct where all participants have perfect information, goods are homogenous, there are no barriers to entry or exit, and prices are determined solely by supply and demand. It's an idealized model used for analysis,
When MP₁ becomes negative, TP start to decline.
Extuples Suppose that the short-run production function of certain cut-flower firm is given by: Q=4KL-0.6K2 - 0.112 •
Where is quantity of cut flower produced, I is labour input and K is fixed capital input (K-5). Determine the average product of lab
Kelo
Extuples Suppose that the short-run production function of certain cut-flower firm is given by: Q=4KL-0.6K2 - 0.112 •
Where is quantity of cut flower produced, I is labour input and K is fixed capital input (K-5). Determine the average product of labour (APL) and marginal product of labour (MPL)
Quantity demanded refers to the specific amount of a good or service that consumers are willing and able to purchase at a give price and within a specific time period. Demand, on the other hand, is a broader concept that encompasses the entire relationship between price and quantity demanded
Ezea
ok
Shukri
how do you save a country economic situation when it's falling apart
Economic growth as an increase in the production and consumption of goods and services within an economy.but
Economic development as a broader concept that encompasses not only economic growth but also social & human well being.
Shukri
production function means
Jabir
What do you think is more important to focus on when considering inequality ?
sir...I just want to ask one question... Define the term contract curve? if you are free please help me to find this answer 🙏
Asui
it is a curve that we get after connecting the pareto optimal combinations of two consumers after their mutually beneficial trade offs
Awais
thank you so much 👍 sir
Asui
In economics, the contract curve refers to the set of points in an Edgeworth box diagram where both parties involved in a trade cannot be made better off without making one of them worse off. It represents the Pareto efficient allocations of goods between two individuals or entities, where neither p
Cornelius
In economics, the contract curve refers to the set of points in an Edgeworth box diagram where both parties involved in a trade cannot be made better off without making one of them worse off. It represents the Pareto efficient allocations of goods between two individuals or entities,
Cornelius
Suppose a consumer consuming two commodities X and Y has
The following utility function u=X0.4 Y0.6. If the price of the X and Y are 2 and 3 respectively and income Constraint is birr 50.
A,Calculate quantities of x and y which maximize utility.
B,Calculate value of Lagrange multiplier.
C,Calculate quantities of X and Y consumed with a given price.
D,alculate optimum level of output .
the market for lemon has 10 potential consumers, each having an individual demand curve p=101-10Qi, where p is price in dollar's per cup and Qi is the number of cups demanded per week by the i th consumer.Find the market demand curve using algebra. Draw an individual demand curve and the market dema
suppose the production function is given by ( L, K)=L¼K¾.assuming capital is fixed find APL and MPL. consider the following short run production function:Q=6L²-0.4L³ a) find the value of L that maximizes output b)find the value of L that maximizes marginal product


![Graph of a function from (-3, 1].](/ocw/mirror/col11758/m51262/CNX_Precalc_Figure_01_02_007.jpg)