We have explored a number of seemingly complex polar curves in this section.
[link] and
[link] summarize the graphs and equations for each of these curves.
Access these online resources for additional instruction and practice with graphs of polar coordinates.
It is easier to graph polar equations if we can test the equations for symmetry with respect to the line
the polar axis, or the pole.
There are three symmetry tests that indicate whether the graph of a polar equation will exhibit symmetry. If an equation fails a symmetry test, the graph may or may not exhibit symmetry. See
[link] .
Polar equations may be graphed by making a table of values for
and
The maximum value of a polar equation is found by substituting the value
that leads to the maximum value of the trigonometric expression.
The zeros of a polar equation are found by setting
and solving for
See
[link] .
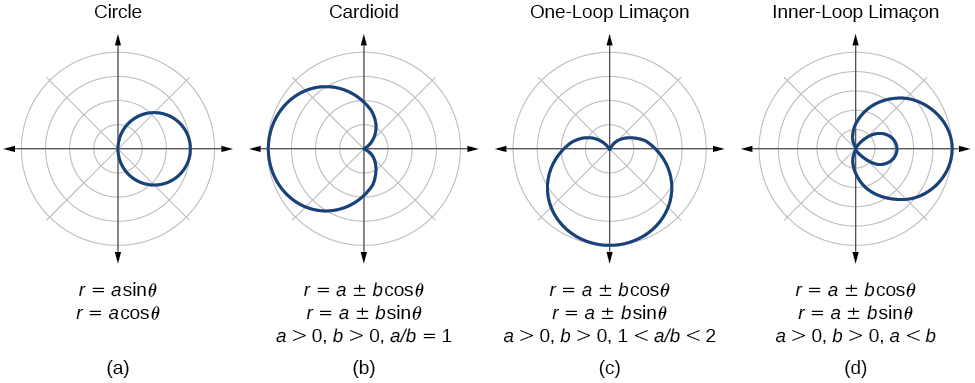
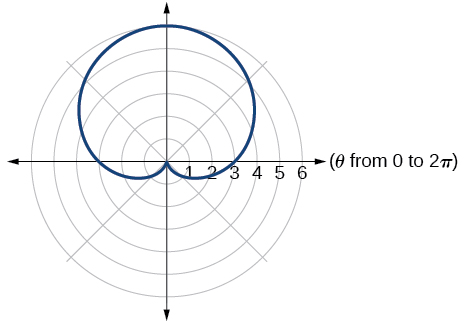
Some formulas that produce the graph of a circle in polar coordinates are given by
and
See
[link] .
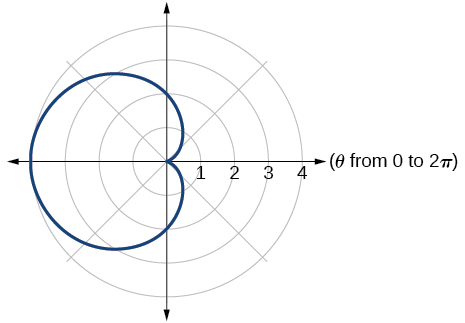
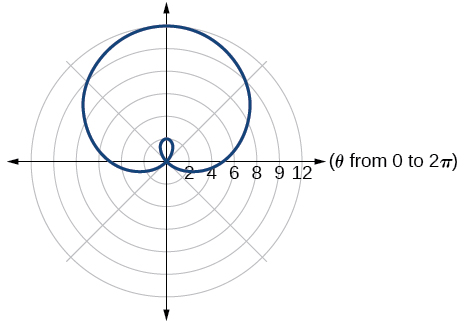
The formulas that produce the graphs of a cardioid are given by
and
for
and
See
[link] .
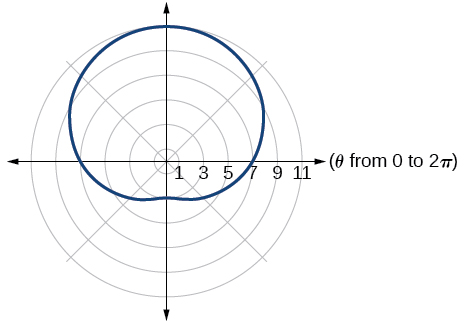
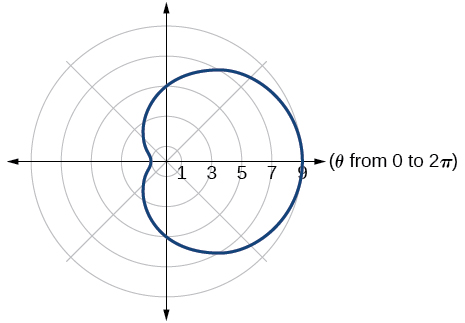
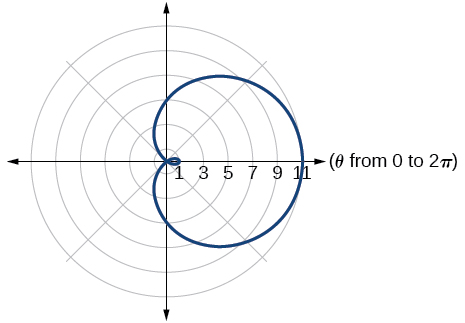
The formulas that produce the graphs of a one-loop limaçon are given by
and
for
See
[link] .
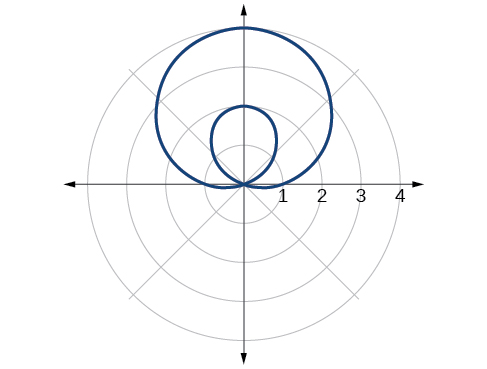
The formulas that produce the graphs of an inner-loop limaçon are given by
and
for
and
See
[link] .
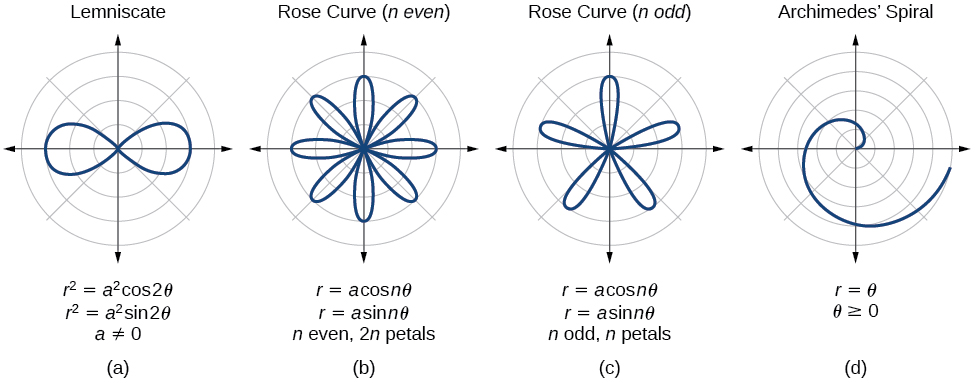
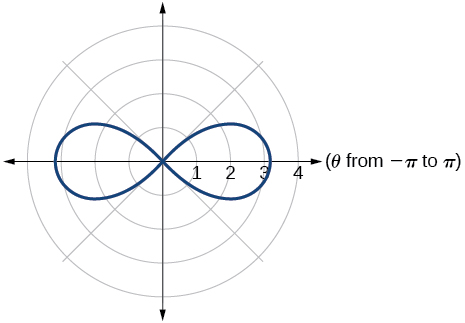
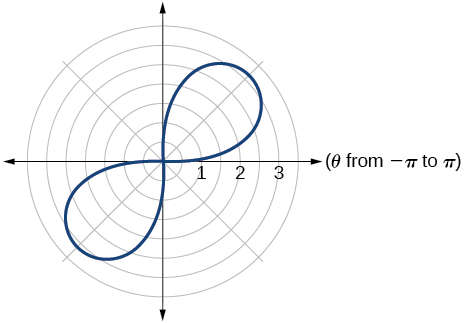
The formulas that produce the graphs of a lemniscates are given by
and
where
See
[link] .
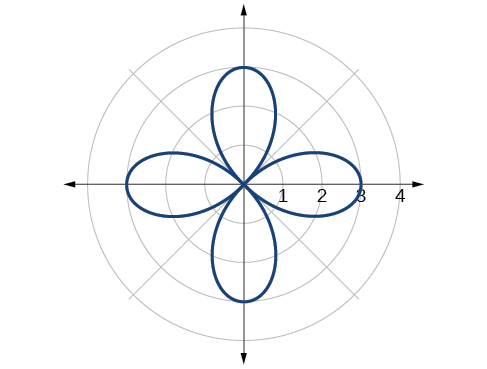
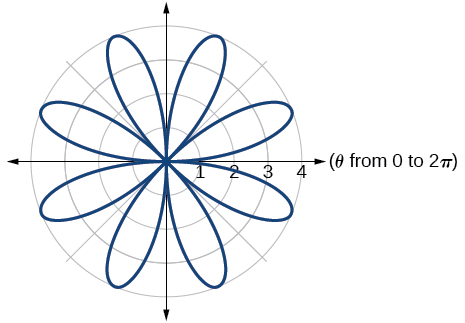
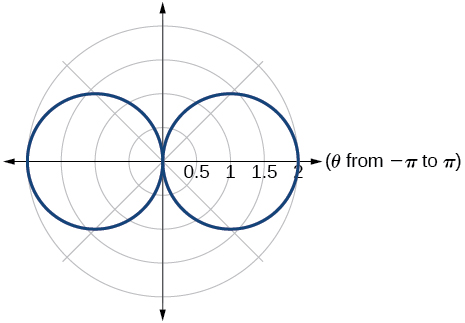
The formulas that produce the graphs of rose curves are given by
and
where
if
is even, there are
petals, and if
is odd, there are
petals. See
[link] and
[link] .
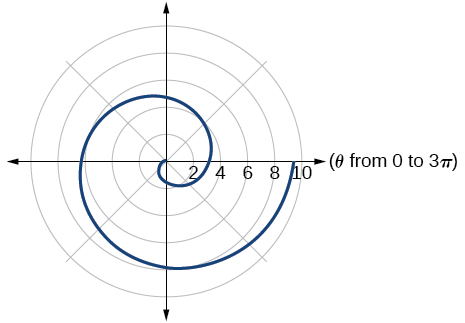
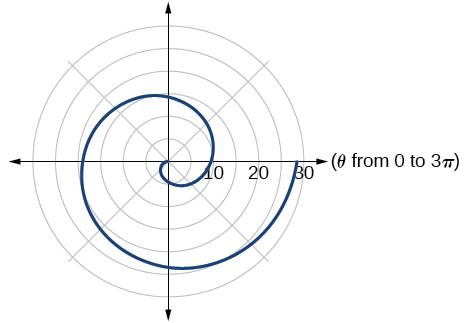
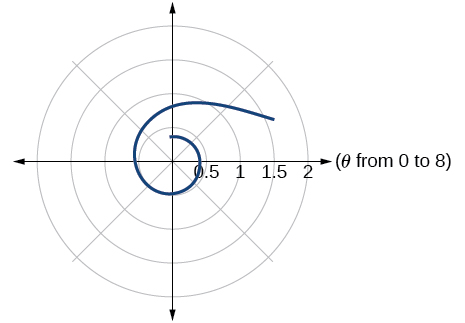
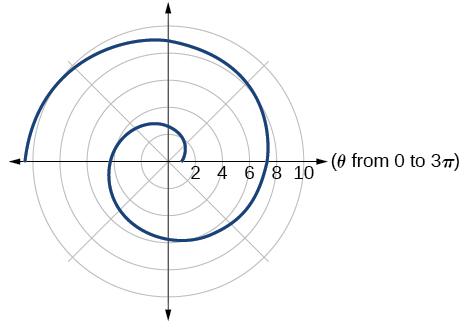
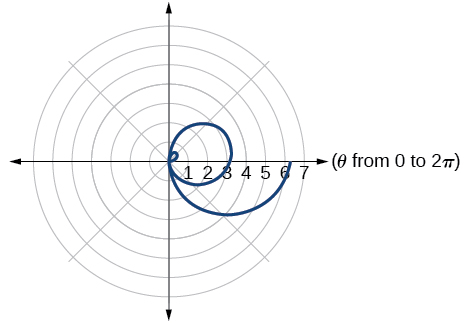
The formula that produces the graph of an Archimedes’ spiral is given by
See
[link] .
Section exercises
Verbal
Describe the three types of symmetry in polar graphs, and compare them to the symmetry of the Cartesian plane.
Symmetry with respect to the polar axis is similar to symmetry about the
-axis, symmetry with respect to the pole is similar to symmetry about the origin, and symmetric with respect to the line
is similar to symmetry about the
-axis.
What are the steps to follow when graphing polar equations?
Test for symmetry; find zeros, intercepts, and maxima; make a table of values. Decide the general type of graph, cardioid, limaçon, lemniscate, etc., then plot points at
and sketch the graph.
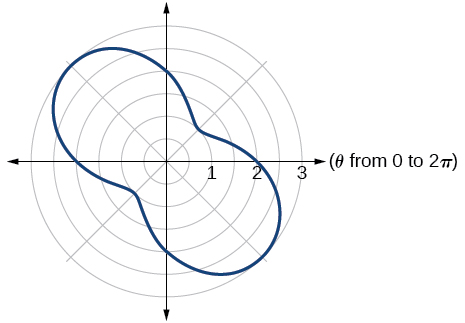
For the following exercises, use a graphing utility to graph each pair of polar equations on a domain of
and then explain the differences shown in the graphs.
Both graphs are curves with 2 loops. The equation with a coefficient of
has two loops on the left, the equation with a coefficient of 2 has two loops side by side. Graph these from 0 to
to get a better picture.
In economics, a perfect market refers to a theoretical construct where all participants have perfect information, goods are homogenous, there are no barriers to entry or exit, and prices are determined solely by supply and demand. It's an idealized model used for analysis,
When MP₁ becomes negative, TP start to decline.
Extuples Suppose that the short-run production function of certain cut-flower firm is given by: Q=4KL-0.6K2 - 0.112 •
Where is quantity of cut flower produced, I is labour input and K is fixed capital input (K-5). Determine the average product of lab
Kelo
Extuples Suppose that the short-run production function of certain cut-flower firm is given by: Q=4KL-0.6K2 - 0.112 •
Where is quantity of cut flower produced, I is labour input and K is fixed capital input (K-5). Determine the average product of labour (APL) and marginal product of labour (MPL)
Quantity demanded refers to the specific amount of a good or service that consumers are willing and able to purchase at a give price and within a specific time period. Demand, on the other hand, is a broader concept that encompasses the entire relationship between price and quantity demanded
Ezea
ok
Shukri
how do you save a country economic situation when it's falling apart
Economic growth as an increase in the production and consumption of goods and services within an economy.but
Economic development as a broader concept that encompasses not only economic growth but also social & human well being.
Shukri
production function means
Jabir
What do you think is more important to focus on when considering inequality ?
sir...I just want to ask one question... Define the term contract curve? if you are free please help me to find this answer 🙏
Asui
it is a curve that we get after connecting the pareto optimal combinations of two consumers after their mutually beneficial trade offs
Awais
thank you so much 👍 sir
Asui
In economics, the contract curve refers to the set of points in an Edgeworth box diagram where both parties involved in a trade cannot be made better off without making one of them worse off. It represents the Pareto efficient allocations of goods between two individuals or entities, where neither p
Cornelius
In economics, the contract curve refers to the set of points in an Edgeworth box diagram where both parties involved in a trade cannot be made better off without making one of them worse off. It represents the Pareto efficient allocations of goods between two individuals or entities,
Cornelius
Suppose a consumer consuming two commodities X and Y has
The following utility function u=X0.4 Y0.6. If the price of the X and Y are 2 and 3 respectively and income Constraint is birr 50.
A,Calculate quantities of x and y which maximize utility.
B,Calculate value of Lagrange multiplier.
C,Calculate quantities of X and Y consumed with a given price.
D,alculate optimum level of output .
the market for lemon has 10 potential consumers, each having an individual demand curve p=101-10Qi, where p is price in dollar's per cup and Qi is the number of cups demanded per week by the i th consumer.Find the market demand curve using algebra. Draw an individual demand curve and the market dema
suppose the production function is given by ( L, K)=L¼K¾.assuming capital is fixed find APL and MPL. consider the following short run production function:Q=6L²-0.4L³ a) find the value of L that maximizes output b)find the value of L that maximizes marginal product