<< Chapter < Page Chapter >> Page >

The gravitational force on a planet a distance r from the sun is given by the function G ( r ) . The acceleration of a planet subjected to any force F is given by the function a ( F ) . Form a meaningful composition of these two functions, and explain what it means.

A gravitational force is still a force, so a ( G ( r ) ) makes sense as the acceleration of a planet at a distance r from the Sun (due to gravity), but G ( a ( F ) ) does not make sense.

Got questions? Get instant answers now!

Evaluating composite functions

Once we compose a new function from two existing functions, we need to be able to evaluate it for any input in its domain. We will do this with specific numerical inputs for functions expressed as tables, graphs, and formulas and with variables as inputs to functions expressed as formulas. In each case, we evaluate the inner function using the starting input and then use the inner function’s output as the input for the outer function.

Evaluating composite functions using tables

When working with functions given as tables, we read input and output values from the table entries and always work from the inside to the outside. We evaluate the inside function first and then use the output of the inside function as the input to the outside function.

Using a table to evaluate a composite function

Using [link] , evaluate f ( g ( 3 ) ) and g ( f ( 3 ) ) .

x f ( x ) g ( x )
1 6 3
2 8 5
3 3 2
4 1 7

To evaluate f ( g ( 3 ) ), we start from the inside with the input value 3. We then evaluate the inside expression g ( 3 ) using the table that defines the function g : g ( 3 ) = 2. We can then use that result as the input to the function f , so g ( 3 ) is replaced by 2 and we get f ( 2 ) . Then, using the table that defines the function f , we find that f ( 2 ) = 8.

g ( 3 ) = 2 f ( g ( 3 ) ) = f ( 2 ) = 8

To evaluate g ( f ( 3 ) ), we first evaluate the inside expression f ( 3 ) using the first table: f ( 3 ) = 3. Then, using the table for g ,  we can evaluate

g ( f ( 3 ) ) = g ( 3 ) = 2

[link] shows the composite functions f g and g f as tables.

x g ( x ) f ( g ( x ) ) f ( x ) g ( f ( x ) )
3 2 8 3 2
Got questions? Get instant answers now!

Using [link] , evaluate f ( g ( 1 ) ) and g ( f ( 4 ) ) .

f ( g ( 1 ) ) = f ( 3 ) = 3 and g ( f ( 4 ) ) = g ( 1 ) = 3

Got questions? Get instant answers now!

Evaluating composite functions using graphs

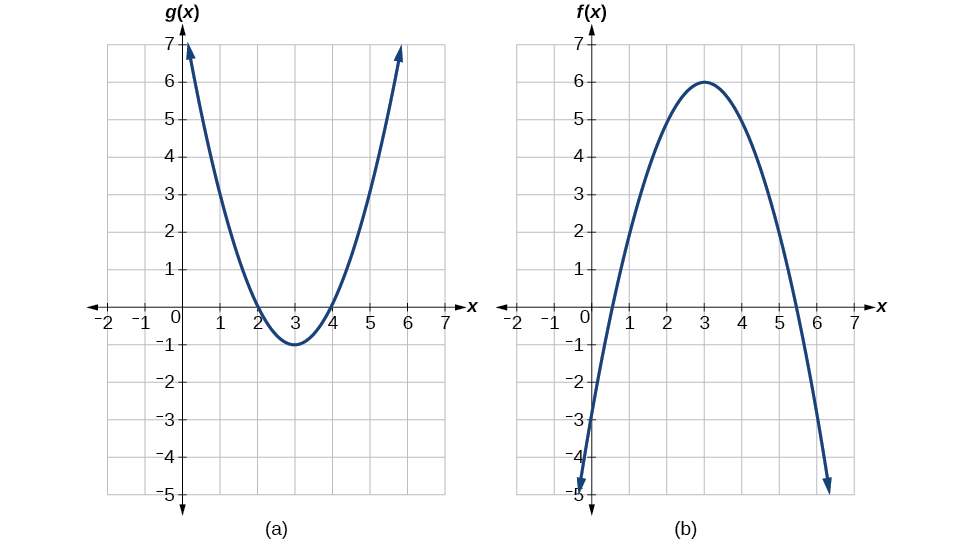
When we are given individual functions as graphs, the procedure for evaluating composite functions is similar to the process we use for evaluating tables. We read the input and output values, but this time, from the x - and y - axes of the graphs.

Given a composite function and graphs of its individual functions, evaluate it using the information provided by the graphs.

  1. Locate the given input to the inner function on the x - axis of its graph.
  2. Read off the output of the inner function from the y - axis of its graph.
  3. Locate the inner function output on the x - axis of the graph of the outer function.
  4. Read the output of the outer function from the y - axis of its graph. This is the output of the composite function.

Using a graph to evaluate a composite function

Using [link] , evaluate f ( g ( 1 ) ) .

Explanation of the composite function.

To evaluate f ( g ( 1 ) ) , we start with the inside evaluation. See [link] .
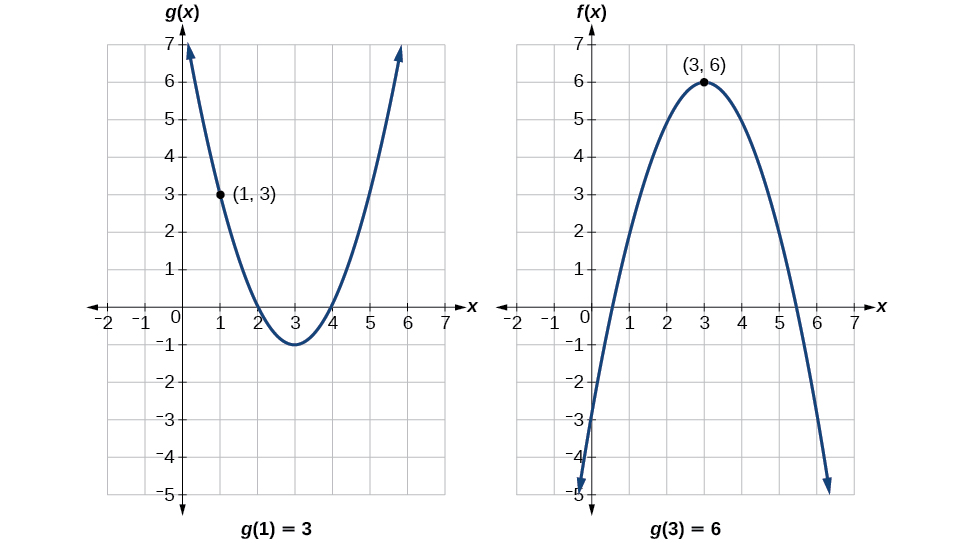
Two graphs of a positive parabola (g(x)) and a negative parabola (f(x)). The following points are plotted: g(1)=3 and f(3)=6.

We evaluate g ( 1 ) using the graph of g ( x ) , finding the input of 1 on the x - axis and finding the output value of the graph at that input. Here, g ( 1 ) = 3. We use this value as the input to the function f .

f ( g ( 1 ) ) = f ( 3 )

We can then evaluate the composite function by looking to the graph of f ( x ) , finding the input of 3 on the x - axis and reading the output value of the graph at this input. Here, f ( 3 ) = 6 , so f ( g ( 1 ) ) = 6.

Got questions? Get instant answers now!

Questions & Answers

how do you get the 2/50
Abba Reply
number of sport play by 50 student construct discrete data
Aminu Reply
width of the frangebany leaves on how to write a introduction
Theresa Reply
Solve the mean of variance
Veronica Reply
Step 1: Find the mean. To find the mean, add up all the scores, then divide them by the number of scores. ... Step 2: Find each score's deviation from the mean. ... Step 3: Square each deviation from the mean. ... Step 4: Find the sum of squares. ... Step 5: Divide the sum of squares by n – 1 or N.
kenneth
what is error
Yakuba Reply
Is mistake done to something
Vutshila
Hy
anas
hy
What is the life teble
anas
hy
Jibrin
statistics is the analyzing of data
Tajudeen Reply
what is statics?
Zelalem Reply
how do you calculate mean
Gloria Reply
diveving the sum if all values
Shaynaynay
let A1,A2 and A3 events be independent,show that (A1)^c, (A2)^c and (A3)^c are independent?
Fisaye Reply
what is statistics
Akhisani Reply
data collected all over the world
Shaynaynay
construct a less than and more than table
Imad Reply
The sample of 16 students is taken. The average age in the sample was 22 years with astandard deviation of 6 years. Construct a 95% confidence interval for the age of the population.
Aschalew Reply
Bhartdarshan' is an internet-based travel agency wherein customer can see videos of the cities they plant to visit. The number of hits daily is a normally distributed random variable with a mean of 10,000 and a standard deviation of 2,400 a. what is the probability of getting more than 12,000 hits? b. what is the probability of getting fewer than 9,000 hits?
Akshay Reply
Bhartdarshan'is an internet-based travel agency wherein customer can see videos of the cities they plan to visit. The number of hits daily is a normally distributed random variable with a mean of 10,000 and a standard deviation of 2,400. a. What is the probability of getting more than 12,000 hits
Akshay
1
Bright
Sorry i want to learn more about this question
Bright
Someone help
Bright
a= 0.20233 b=0.3384
Sufiyan
a
Shaynaynay
How do I interpret level of significance?
Mohd Reply
It depends on your business problem or in Machine Learning you could use ROC- AUC cruve to decide the threshold value
Shivam
how skewness and kurtosis are used in statistics
Owen Reply
yes what is it
Taneeya
Got questions? Join the online conversation and get instant answers!
Jobilize.com Reply
Practice Key Terms 1

Get Jobilize Job Search Mobile App in your pocket Now!

Get it on Google Play Download on the App Store Now


Source:  OpenStax, Algebra and trigonometry. OpenStax CNX. Nov 14, 2016 Download for free at https://legacy.cnx.org/content/col11758/1.6
Google Play and the Google Play logo are trademarks of Google Inc.

Notification Switch

Would you like to follow the 'Algebra and trigonometry' conversation and receive update notifications?

Ask