<< Chapter < Page Chapter >> Page >

Using logarithmic regression to fit a model to data

Due to advances in medicine and higher standards of living, life expectancy has been increasing in most developed countries since the beginning of the 20th century.

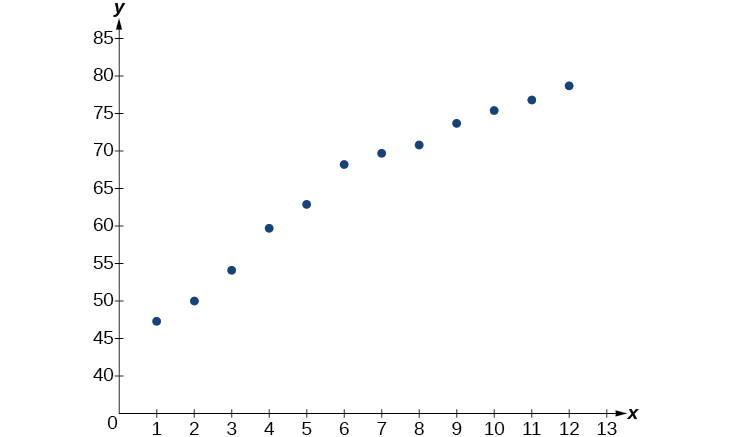
[link] shows the average life expectancies, in years, of Americans from 1900–2010 Source: Center for Disease Control and Prevention, 2013 .

Year 1900 1910 1920 1930 1940 1950
Life Expectancy(Years) 47.3 50.0 54.1 59.7 62.9 68.2
Year 1960 1970 1980 1990 2000 2010
Life Expectancy(Years) 69.7 70.8 73.7 75.4 76.8 78.7
  1. Let x represent time in decades starting with x = 1 for the year 1900, x = 2 for the year 1910, and so on. Let y represent the corresponding life expectancy. Use logarithmic regression to fit a model to these data.
  2. Use the model to predict the average American life expectancy for the year 2030.
  1. Using the STAT then EDIT menu on a graphing utility, list the years using values 1–12 in L1 and the corresponding life expectancy in L2. Then use the STATPLOT feature to verify that the scatterplot follows a logarithmic pattern as shown in [link] :
    Graph of a scattered plot.

    Use the “LnReg” command from the STAT then CALC menu to obtain the logarithmic model,

    y = 42.52722583 + 13.85752327 ln ( x )

    Next, graph the model in the same window as the scatterplot to verify it is a good fit as shown in [link] :

    Graph of a scattered plot with an estimation line.
  2. To predict the life expectancy of an American in the year 2030, substitute x = 14 for the in the model and solve for y :
    y = 42.52722583 + 13.85752327 ln ( x ) Use the regression model found in part (a) . = 42.52722583 + 13.85752327 ln ( 14 ) Substitute 14 for  x . 79 .1 Round to the nearest tenth.

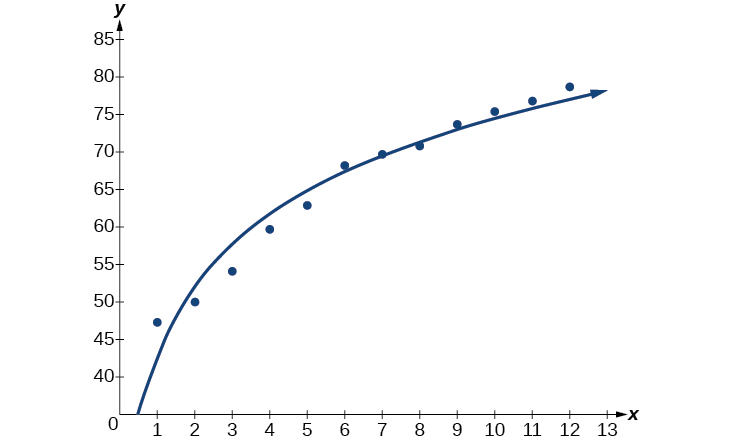
    If life expectancy continues to increase at this pace, the average life expectancy of an American will be 79.1 by the year 2030.

Got questions? Get instant answers now!

Sales of a video game released in the year 2000 took off at first, but then steadily slowed as time moved on. [link] shows the number of games sold, in thousands, from the years 2000–2010.

Year 2000 2001 2002 2003 2004 2005
Number Sold (thousands) 142 149 154 155 159 161
Year 2006 2007 2008 2009 2010 -
Number Sold (thousands) 163 164 164 166 167 -
  1. Let x represent time in years starting with x = 1 for the year 2000. Let y represent the number of games sold in thousands. Use logarithmic regression to fit a model to these data.
  2. If games continue to sell at this rate, how many games will sell in 2015? Round to the nearest thousand.
  1. The logarithmic regression model that fits these data is y = 141.91242949 + 10.45366573 ln ( x )
  2. If sales continue at this rate, about 171,000 games will be sold in the year 2015.
Got questions? Get instant answers now!

Building a logistic model from data

Like exponential and logarithmic growth, logistic growth increases over time. One of the most notable differences with logistic growth models is that, at a certain point, growth steadily slows and the function approaches an upper bound, or limiting value . Because of this, logistic regression is best for modeling phenomena where there are limits in expansion, such as availability of living space or nutrients.

It is worth pointing out that logistic functions actually model resource-limited exponential growth. There are many examples of this type of growth in real-world situations, including population growth and spread of disease, rumors, and even stains in fabric. When performing logistic regression analysis , we use the form most commonly used on graphing utilities:

Questions & Answers

A golfer on a fairway is 70 m away from the green, which sits below the level of the fairway by 20 m. If the golfer hits the ball at an angle of 40° with an initial speed of 20 m/s, how close to the green does she come?
Aislinn Reply
cm
tijani
what is titration
John Reply
what is physics
Siyaka Reply
A mouse of mass 200 g falls 100 m down a vertical mine shaft and lands at the bottom with a speed of 8.0 m/s. During its fall, how much work is done on the mouse by air resistance
Jude Reply
Can you compute that for me. Ty
Jude
what is the dimension formula of energy?
David Reply
what is viscosity?
David
what is inorganic
emma Reply
what is chemistry
Youesf Reply
what is inorganic
emma
Chemistry is a branch of science that deals with the study of matter,it composition,it structure and the changes it undergoes
Adjei
please, I'm a physics student and I need help in physics
Adjanou
chemistry could also be understood like the sexual attraction/repulsion of the male and female elements. the reaction varies depending on the energy differences of each given gender. + masculine -female.
Pedro
A ball is thrown straight up.it passes a 2.0m high window 7.50 m off the ground on it path up and takes 1.30 s to go past the window.what was the ball initial velocity
Krampah Reply
2. A sled plus passenger with total mass 50 kg is pulled 20 m across the snow (0.20) at constant velocity by a force directed 25° above the horizontal. Calculate (a) the work of the applied force, (b) the work of friction, and (c) the total work.
Sahid Reply
you have been hired as an espert witness in a court case involving an automobile accident. the accident involved car A of mass 1500kg which crashed into stationary car B of mass 1100kg. the driver of car A applied his brakes 15 m before he skidded and crashed into car B. after the collision, car A s
Samuel Reply
can someone explain to me, an ignorant high school student, why the trend of the graph doesn't follow the fact that the higher frequency a sound wave is, the more power it is, hence, making me think the phons output would follow this general trend?
Joseph Reply
Nevermind i just realied that the graph is the phons output for a person with normal hearing and not just the phons output of the sound waves power, I should read the entire thing next time
Joseph
Follow up question, does anyone know where I can find a graph that accuretly depicts the actual relative "power" output of sound over its frequency instead of just humans hearing
Joseph
"Generation of electrical energy from sound energy | IEEE Conference Publication | IEEE Xplore" ***ieeexplore.ieee.org/document/7150687?reload=true
Ryan
what's motion
Maurice Reply
what are the types of wave
Maurice
answer
Magreth
progressive wave
Magreth
hello friend how are you
Muhammad Reply
fine, how about you?
Mohammed
hi
Mujahid
A string is 3.00 m long with a mass of 5.00 g. The string is held taut with a tension of 500.00 N applied to the string. A pulse is sent down the string. How long does it take the pulse to travel the 3.00 m of the string?
yasuo Reply
Who can show me the full solution in this problem?
Reofrir Reply
Got questions? Join the online conversation and get instant answers!
Jobilize.com Reply

Get Jobilize Job Search Mobile App in your pocket Now!

Get it on Google Play Download on the App Store Now


Source:  OpenStax, Algebra and trigonometry. OpenStax CNX. Nov 14, 2016 Download for free at https://legacy.cnx.org/content/col11758/1.6
Google Play and the Google Play logo are trademarks of Google Inc.

Notification Switch

Would you like to follow the 'Algebra and trigonometry' conversation and receive update notifications?

Ask