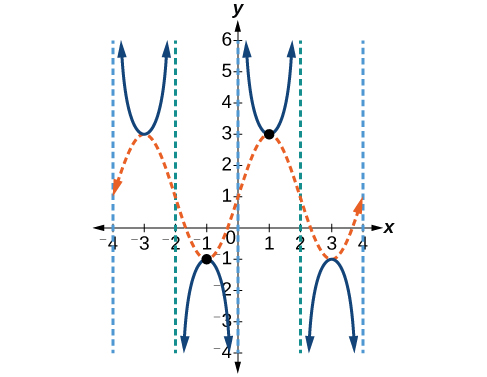
The domain of
was given to be all
such that
for any integer
Would the domain of
Yes. The excluded points of the domain follow the vertical asymptotes. Their locations show the horizontal shift and compression or expansion implied by the transformation to the original function’s input.
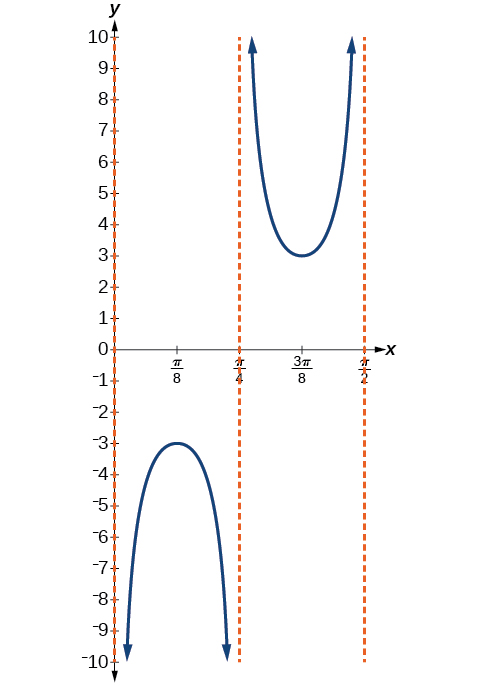
Given a function of the form
graph one period.
Express the function given in the form
Identify
and determine the period,
Draw the graph of
Use the reciprocal relationship between
and
to draw the graph of
Sketch the asymptotes.
Plot any two reference points and draw the graph through these points.
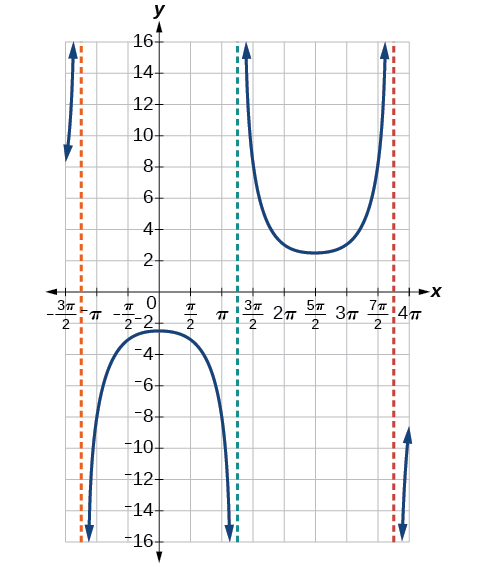
Graphing a variation of the cosecant function
Graph one period of
Step 1. The given function is already written in the general form,
Step 2.
so the stretching factor is 3.
Step 3.
so
The period is
units.
Step 4. Sketch the graph of the function
Step 5. Use the reciprocal relationship of the sine and cosecant functions to draw the
cosecant function .
Steps 6–7. Sketch three asymptotes at
and
We can use two reference points, the local maximum at
and the local minimum at
[link] shows the graph.
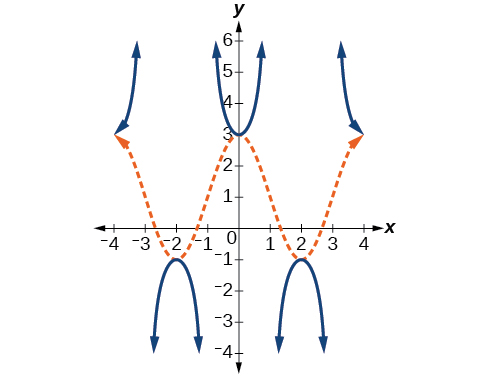
The last trigonometric function we need to explore is
cotangent . The cotangent is defined by the
reciprocal identity
Notice that the function is undefined when the tangent function is 0, leading to a vertical asymptote in the graph at
etc. Since the output of the tangent function is all real numbers, the output of the
cotangent function is also all real numbers.
We can graph
by observing the graph of the tangent function because these two functions are reciprocals of one another. See
[link] . Where the graph of the tangent function decreases, the graph of the cotangent function increases. Where the graph of the tangent function increases, the graph of the cotangent function decreases.
Step 1: Find the mean. To find the mean, add up all the scores, then divide them by the number of scores. ...
Step 2: Find each score's deviation from the mean. ...
Step 3: Square each deviation from the mean. ...
Step 4: Find the sum of squares. ...
Step 5: Divide the sum of squares by n – 1 or N.
The sample of 16 students is taken. The average age in the sample was 22 years with astandard deviation of 6 years. Construct a 95% confidence interval for the age of the population.
Bhartdarshan' is an internet-based travel agency wherein customer can see videos of the cities they plant to visit. The number of hits daily is a normally distributed random variable with a mean of 10,000 and a standard deviation of 2,400
a. what is the probability of getting more than 12,000 hits?
b. what is the probability of getting fewer than 9,000 hits?
Bhartdarshan'is an internet-based travel agency wherein customer can see videos of the cities they plan to visit. The number of hits daily is a normally distributed random variable with a mean of 10,000 and a standard deviation of 2,400.
a. What is the probability of getting more than 12,000 hits


![A graph of two periods of a modified cosine function. Range is [-1,3], graphed from x=-4 to x=4.](/ocw/mirror/col11758/m49389/CNX_Precalc_Figure_06_02_015.jpg)