| << Chapter < Page | Chapter >> Page > |
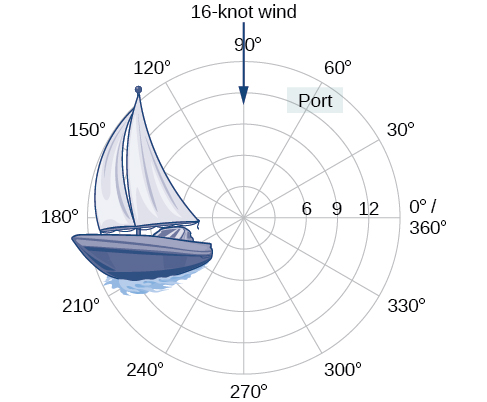
Over 12 kilometers from port, a sailboat encounters rough weather and is blown off course by a 16-knot wind (see [link] ). How can the sailor indicate his location to the Coast Guard? In this section, we will investigate a method of representing location that is different from a standard coordinate grid.
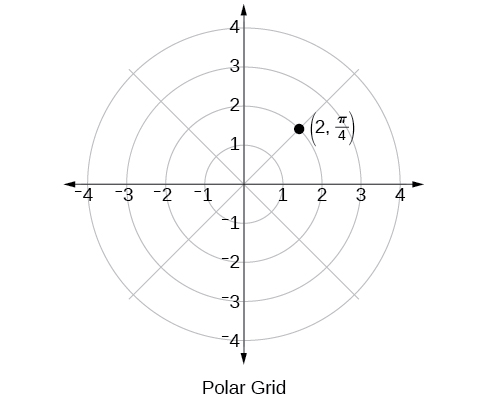
When we think about plotting points in the plane, we usually think of rectangular coordinates in the Cartesian coordinate plane. However, there are other ways of writing a coordinate pair and other types of grid systems. In this section, we introduce to polar coordinates , which are points labeled and plotted on a polar grid. The polar grid is represented as a series of concentric circles radiating out from the pole , or the origin of the coordinate plane.
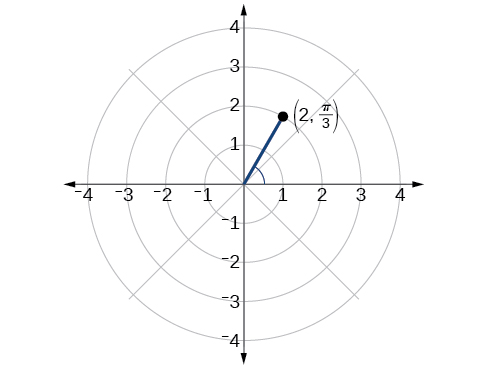
The polar grid is scaled as the unit circle with the positive x- axis now viewed as the polar axis and the origin as the pole. The first coordinate is the radius or length of the directed line segment from the pole. The angle measured in radians, indicates the direction of We move counterclockwise from the polar axis by an angle of and measure a directed line segment the length of in the direction of Even though we measure first and then the polar point is written with the r -coordinate first. For example, to plot the point we would move units in the counterclockwise direction and then a length of 2 from the pole. This point is plotted on the grid in [link] .
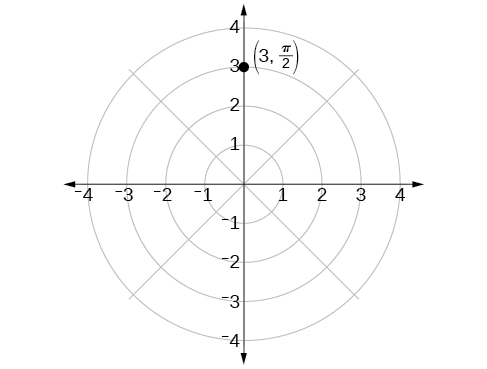
Plot the point on the polar grid.
The angle is found by sweeping in a counterclockwise direction 90° from the polar axis. The point is located at a length of 3 units from the pole in the direction, as shown in [link] .
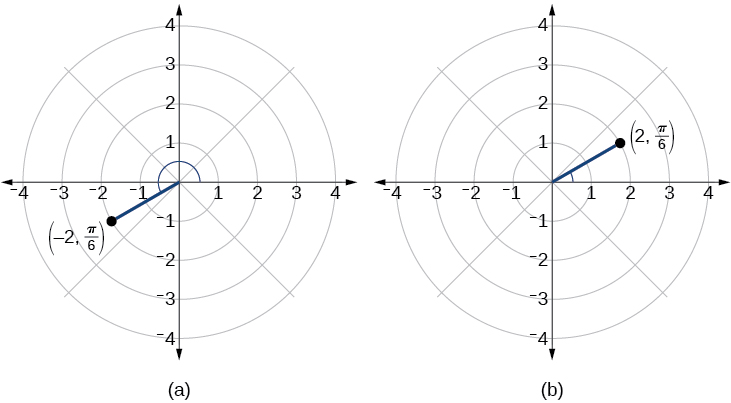
Plot the point on the polar grid.
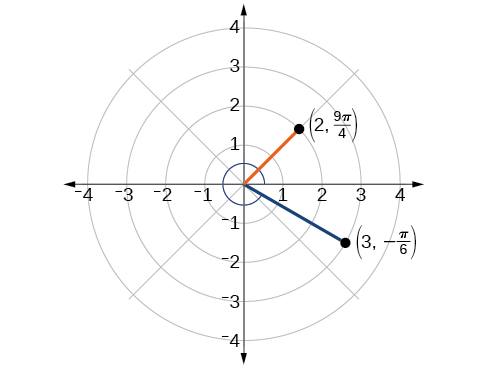
We know that is located in the first quadrant. However, We can approach plotting a point with a negative in two ways:
See [link] (a). Compare this to the graph of the polar coordinate shown in [link] (b).
When given a set of polar coordinates , we may need to convert them to rectangular coordinates . To do so, we can recall the relationships that exist among the variables and
Notification Switch
Would you like to follow the 'Algebra and trigonometry' conversation and receive update notifications?

|
|

|
|

|
|

|
|

|
|

|
|

|
|

|
|

|
|

|
|

|