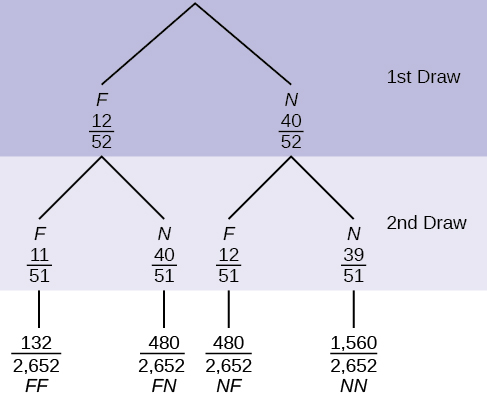
In a standard deck, there are 52 cards. Twelve cards are face cards (
F ) and 40 cards are not face cards (
N ). Draw two cards, one at a time, without replacement. The tree diagram is labeled with all possible probabilities.
Find
P (
FN OR
NF ).
Find
P (
N |
F ).
Find
P (at most one face card).
Hint: "At most one face card" means zero or one face card.
Find
P (at least on face card).
Hint: "At least one face card" means one or two face cards.
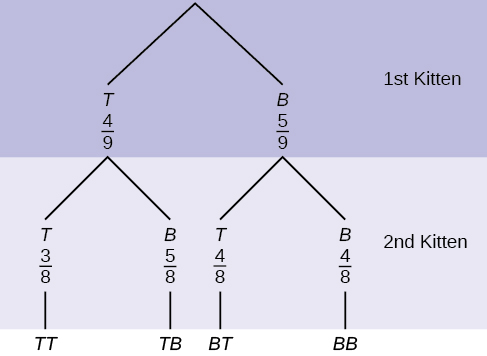
A litter of kittens available for adoption at the Humane Society has four tabby kittens and five black kittens. A family comes in and randomly selects two kittens (without replacement) for adoption.
What is the probability that both kittens are tabby?
a.
b.
c.
d.
What is the probability that one kitten of each coloring is selected?
a.
b.
c.
d.
What is the probability that a tabby is chosen as the second kitten when a black kitten was chosen as the first?
What is the probability of choosing two kittens of the same color?
Suppose there are four red balls and three yellow balls in a box. Three balls are drawn from the box without replacement. What is the probability that one ball of each coloring is selected?
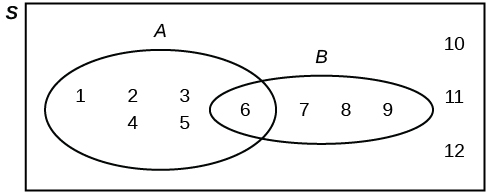
A
Venn diagram is a picture that represents the outcomes of an experiment. It generally consists of a box that represents the sample space S together with circles or ovals. The circles or ovals represent events.
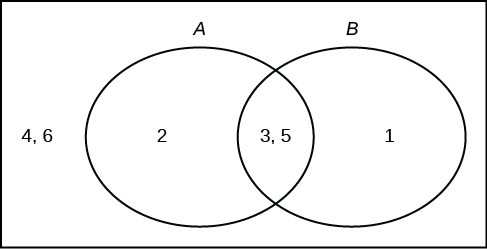
Suppose an experiment has the outcomes 1, 2, 3, ... , 12 where each outcome has an equal chance of occurring. Let event
A = {1, 2, 3, 4, 5, 6} and event
B = {6, 7, 8, 9}. Then
A AND
B = {6} and
A OR
B = {1, 2, 3, 4, 5, 6, 7, 8, 9}. The Venn diagram is as follows:
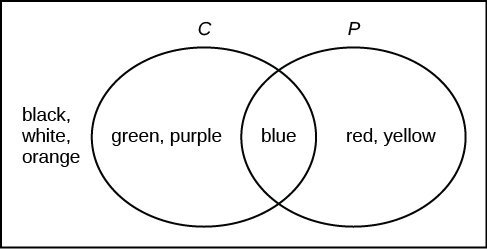
Suppose an experiment has outcomes black, white, red, orange, yellow, green, blue, and purple, where each outcome has an equal chance of occurring. Let event
C = {green, blue, purple} and event
P = {red, yellow, blue}. Then
C AND
P = {blue} and
C OR
P = {green, blue, purple, red, yellow}. Draw a Venn diagram representing this situation.
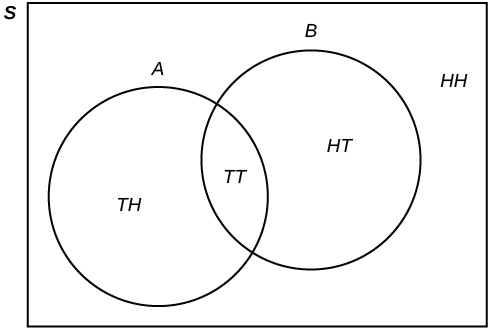
Flip two fair coins. Let
A = tails on the first coin. Let
B = tails on the second coin. Then
A = {
TT ,
TH } and
B = {
TT ,
HT }. Therefore,
A AND
B = {
TT }.
A OR
B = {
TH ,
TT ,
HT }.
The sample space when you flip two fair coins is
X = {
HH ,
HT ,
TH ,
TT }. The outcome
HH is in NEITHER
A NOR
B . The Venn diagram is as follows:
Roll a fair, six-sided die. Let
A = a prime number of dots is rolled. Let
B = an odd number of dots is rolled. Then
A = {2, 3, 5} and
B = {1, 3, 5}. Therefore,
A AND
B = {3, 5}.
A OR
B = {1, 2, 3, 5}. The sample space for rolling a fair die is
S = {1, 2, 3, 4, 5, 6}. Draw a Venn diagram representing this situation.
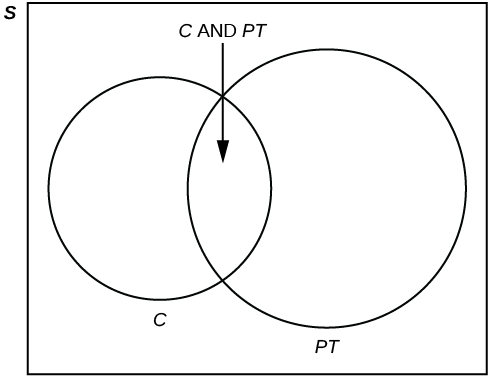
Forty percent of the students at a local college belong to a club and
50% work part time.
Five percent of the students work part time and belong to a club. Draw a Venn diagram showing the relationships. Let
C = student belongs to a club and
PT = student works part time.
If a student is selected at random, find
the probability that the student belongs to a club.
P (
C ) = 0.40
the probability that the student works part time.
P (
PT ) = 0.50
the probability that the student belongs to a club AND works part time.
P (
C AND
PT ) = 0.05
the probability that the student belongs to a club
given that the student works part time.
the probability that the student belongs to a club
OR works part time.
P (
C OR
PT ) =
P (
C ) +
P (
PT ) -
P (
C AND
PT ) = 0.40 + 0.50 - 0.05 = 0.85
Abiotic factors are non living components of ecosystem.These include physical and chemical elements like temperature,light,water,soil,air quality and oxygen etc