Because
r is significant and the scatter plot shows a linear trend, the regression line can be used to predict final exam scores.
Method 2: using a table of critical values to make a decision
The
95% Critical Values of the Sample Correlation Coefficient Table can be used to give you a good idea of whether the computed value of
is significant or not . Compare
r to the appropriate critical value in the table. If
r is not between the positive and negative critical values, then the correlation coefficient is significant. If
r is significant, then you may want to use the line for prediction.
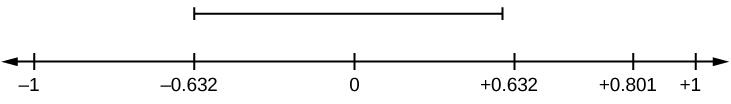
Suppose you computed
r = 0.801 using
n = 10 data points.
df =
n - 2 = 10 - 2 = 8. The critical values associated with
df = 8 are -0.632 and + 0.632. If
r <negative critical value or
r >positive critical value, then
r issignificant. Since
r = 0.801 and 0.801>0.632,
r is significant and the line may be usedfor prediction. If you view this example on a number line, it will help you.
r is not significant between -0.632 and +0.632.
r = 0.801>+0.632. Therefore,
r is significant.
For a given line of best fit, you computed that
r = 0.6501 using
n = 12 data points and the critical value is 0.576. Can the line be used for prediction? Why or why not?
If the scatter plot looks linear then, yes, the line can be used for prediction, because
r >the positive critical value.
Suppose you computed
r = –0.624 with 14 data points.
df = 14 – 2 = 12. The critical values are –0.532 and 0.532. Since –0.624<–0.532,
r is significant and the line can be used for prediction
For a given line of best fit, you compute that
r = 0.5204 using
n = 9 data points, and the critical value is 0.666. Can the line be used for prediction? Why or why not?
No, the line cannot be used for prediction, because
r <the positive critical value.
Suppose you computed
r = 0.776 and
n = 6.
df = 6 – 2 = 4. The critical values are –0.811 and 0.811. Since –0.811<0.776<0.811,
r is not significant, and the line should not be used for prediction.
-0.811<
r = 0.776<0.811. Therefore,
r is not significant.
For a given line of best fit, you compute that
r = –0.7204 using
n = 8 data points, and the critical value is = 0.707. Can the line be used for prediction? Why or why not?
Yes, the line can be used for prediction, because r<the negative critical value.
Third-exam vs final-exam example: critical value method
Consider the
third exam/final exam example .
The line of best fit is:
ŷ = –173.51+4.83
x with
r = 0.6631 and there are
n = 11 data points. Can the regression line be used for prediction?
Given a third-exam score (
x value), can we use the line to predict the final exam score (predicted
y value)?
H
0 :
ρ = 0
H
a :
ρ ≠ 0
α = 0.05
Use the "95% Critical Value" table for
r with
df =
n – 2 = 11 – 2 = 9.
The critical values are –0.602 and +0.602
Since 0.6631>0.602,
r is significant.
Decision: Reject the null hypothesis.
Conclusion:There is sufficient evidence to conclude that there is a significant linear relationship between the third exam score (
x ) and the final exam score (
y ) because the correlation coefficient is significantly different from zero.
Questions & Answers
Ayele, K., 2003. Introductory Economics, 3rd ed., Addis Ababa.
what's the difference between a firm and an industry
Abdul
firm is the unit which transform inputs to output where as industry contain combination of firms with similar production 😅😅
Abdulraufu
Suppose the demand function that a firm faces shifted from
Qd 120 3P
to
Qd 90 3P
and the supply function has shifted from
QS
20 2P
to
QS
10 2P .
a) Find the effect of this change on price and quantity.
b) Which of the changes in demand and supply is higher?
Demand curve shows that how supply and others conditions affect on demand of a particular thing and what percent demand increase whith increase of supply of goods
Israr
Hi Sir please how do u calculate Cross elastic demand and income elastic demand?
Abari
Got questions? Join the online conversation and get instant answers!