INTERPRETATION OF THE SLOPE: The slope of the best-fit line tells us how the dependent variable (
y ) changes for every one unit increase in the independent (
x ) variable, on average.
Third exam vs final exam example
Slope: The slope of the line is
b = 4.83.
Interpretation: For a one-point increase in the score on the third exam, the final exam score increases by 4.83 points, on average.
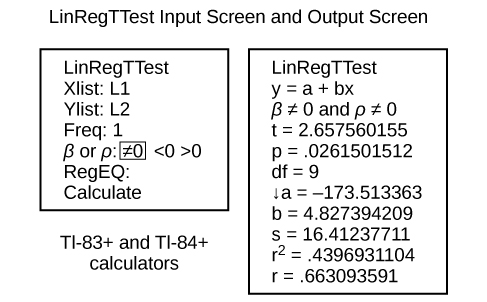
Using the Linear Regression T Test: LinRegTTest
In the STAT list editor, enter the X data in list L1 and the Y data in list L2, paired so that the corresponding (
x ,
y ) values are next to each other in the lists. (If a particular pair of values is repeated, enter it as many times as it appears in the data.)
On the STAT TESTS menu, scroll down with the cursor to select the LinRegTTest. (Be careful to select LinRegTTest, as some calculators may also have a different item called LinRegTInt.)
On the LinRegTTest input screen enter: Xlist: L1 ; Ylist: L2 ; Freq: 1
On the next line, at the prompt
β or
ρ , highlight "≠ 0" and press ENTER
Leave the line for "RegEq:" blank
Highlight Calculate and press ENTER.
The output screen contains a lot of information. For now we will focus on a few items from the output, and will return later to the other items.
The second line says
y =
a +
bx . Scroll down to find the values
a = –173.513, and
b = 4.8273; the equation of the best fit line is
ŷ = –173.51 + 4.83
x The two items at the bottom are
r2 = 0.43969 and
r = 0.663. For now, just note where to find these values; we will discuss them in the next two sections.
Graphing the Scatterplot and Regression Line
We are assuming your X data is already entered in list L1 and your Y data is in list L2
Press 2nd STATPLOT ENTER to use Plot 1
On the input screen for PLOT 1, highlight
On , and press ENTER
For TYPE: highlight the very first icon which is the scatterplot and press ENTER
Indicate Xlist: L1 and Ylist: L2
For Mark: it does not matter which symbol you highlight.
Press the ZOOM key and then the number 9 (for menu item "ZoomStat") ; the calculator will fit the window to the data
To graph the best-fit line, press the "Y=" key and type the equation –173.5 + 4.83X into equation Y1. (The X key is immediately left of the STAT key). Press ZOOM 9 again to graph it.
Optional: If you want to change the viewing window, press the WINDOW key. Enter your desired window using Xmin, Xmax, Ymin, Ymax
Note
Another way to graph the line after you create a scatter plot is to use LinRegTTest.
Make sure you have done the scatter plot. Check it on your screen.
Go to LinRegTTest and enter the lists.
At RegEq: press VARS and arrow over to Y-VARS. Press 1 for 1:Function. Press 1 for 1:Y1. Then arrow down to Calculate and do the calculation for the line of best fit.
Press Y = (you will see the regression equation).
Press GRAPH. The line will be drawn."
The correlation coefficient
r
Besides looking at the scatter plot and seeing that a line seems reasonable, how can you tell if the line is a good predictor? Use the correlation coefficient as another indicator (besides the scatterplot) of the strength of the relationship between
x and
y .
Questions & Answers
What are the factors that affect demand for a commodity
In economics, a perfect market refers to a theoretical construct where all participants have perfect information, goods are homogenous, there are no barriers to entry or exit, and prices are determined solely by supply and demand. It's an idealized model used for analysis,
When MP₁ becomes negative, TP start to decline.
Extuples Suppose that the short-run production function of certain cut-flower firm is given by: Q=4KL-0.6K2 - 0.112 •
Where is quantity of cut flower produced, I is labour input and K is fixed capital input (K-5). Determine the average product of lab
Kelo
Extuples Suppose that the short-run production function of certain cut-flower firm is given by: Q=4KL-0.6K2 - 0.112 •
Where is quantity of cut flower produced, I is labour input and K is fixed capital input (K-5). Determine the average product of labour (APL) and marginal product of labour (MPL)
Quantity demanded refers to the specific amount of a good or service that consumers are willing and able to purchase at a give price and within a specific time period. Demand, on the other hand, is a broader concept that encompasses the entire relationship between price and quantity demanded
Ezea
ok
Shukri
how do you save a country economic situation when it's falling apart
Economic growth as an increase in the production and consumption of goods and services within an economy.but
Economic development as a broader concept that encompasses not only economic growth but also social & human well being.
Shukri
production function means
Jabir
What do you think is more important to focus on when considering inequality ?
sir...I just want to ask one question... Define the term contract curve? if you are free please help me to find this answer 🙏
Asui
it is a curve that we get after connecting the pareto optimal combinations of two consumers after their mutually beneficial trade offs
Awais
thank you so much 👍 sir
Asui
In economics, the contract curve refers to the set of points in an Edgeworth box diagram where both parties involved in a trade cannot be made better off without making one of them worse off. It represents the Pareto efficient allocations of goods between two individuals or entities, where neither p
Cornelius
In economics, the contract curve refers to the set of points in an Edgeworth box diagram where both parties involved in a trade cannot be made better off without making one of them worse off. It represents the Pareto efficient allocations of goods between two individuals or entities,
Cornelius
Suppose a consumer consuming two commodities X and Y has
The following utility function u=X0.4 Y0.6. If the price of the X and Y are 2 and 3 respectively and income Constraint is birr 50.
A,Calculate quantities of x and y which maximize utility.
B,Calculate value of Lagrange multiplier.
C,Calculate quantities of X and Y consumed with a given price.
D,alculate optimum level of output .
the market for lemon has 10 potential consumers, each having an individual demand curve p=101-10Qi, where p is price in dollar's per cup and Qi is the number of cups demanded per week by the i th consumer.Find the market demand curve using algebra. Draw an individual demand curve and the market dema
suppose the production function is given by ( L, K)=L¼K¾.assuming capital is fixed find APL and MPL. consider the following short run production function:Q=6L²-0.4L³ a) find the value of L that maximizes output b)find the value of L that maximizes marginal product
Abdureman
Got questions? Join the online conversation and get instant answers!