<< Chapter < Page Chapter >> Page >

Try it

Maris conducted a study on the effect that playing video games has on memory recall. As part of her study, she compiled the following data:

Hours Teenagers Spend on Video Games Number of Teenagers
0–3.5 3
3.5–7.5 7
7.5–11.5 12
11.5–15.5 7
15.5–19.5 9

What is the best estimate for the mean number of hours spent playing video games?

Find the midpoint of each interval, multiply by the corresponding number of teenagers, add the results and then divide by the total number of teenagers
The midpoints are 1.75, 5.5, 9.5, 13.5,17.5.
Mean = (1.75)(3) + (5.5)(7) + (9.5)(12) + (13.5)(7) + (17.5)(9) = 409.75

Got questions? Get instant answers now!

References

Data from The World Bank, available online at http://www.worldbank.org (accessed April 3, 2013).

“Demographics: Obesity – adult prevalence rate.” Indexmundi. Available online at http://www.indexmundi.com/g/r.aspx?t=50&v=2228&l=en (accessed April 3, 2013).

Chapter review

The mean and the median can be calculated to help you find the "center" of a data set. The mean is the best estimate for the actual data set, but the median is the best measurement when a data set contains several outliers or extreme values. The mode will tell you the most frequently occuring datum (or data) in your data set. The mean, median, and mode are extremely helpful when you need to analyze your data, but if your data set consists of ranges which lack specific values, the mean may seem impossible to calculate. However, the mean can be approximated if you add the lower boundary with the upper boundary and divide by two to find the midpoint of each interval. Multiply each midpoint by the number of values found in the corresponding range. Divide the sum of these values by the total number of data values in the set.

Formula review

μ = f m f Where f = interval frequencies and m = interval midpoints.

Find the mean for the following frequency tables.

  1. Grade Frequency
    49.5–59.5 2
    59.5–69.5 3
    69.5–79.5 8
    79.5–89.5 12
    89.5–99.5 5
  2. Daily Low Temperature Frequency
    49.5–59.5 53
    59.5–69.5 32
    69.5–79.5 15
    79.5–89.5 1
    89.5–99.5 0
  3. Points per Game Frequency
    49.5–59.5 14
    59.5–69.5 32
    69.5–79.5 15
    79.5–89.5 23
    89.5–99.5 2
Got questions? Get instant answers now!

Use the following information to answer the next three exercises: The following data show the lengths of boats moored in a marina. The data are ordered from smallest to largest:

  • 16
  • 17
  • 19
  • 20
  • 20
  • 21
  • 23
  • 24
  • 25
  • 25
  • 25
  • 26
  • 26
  • 27
  • 27
  • 27
  • 28
  • 29
  • 30
  • 32
  • 33
  • 33
  • 34
  • 35
  • 37
  • 39
  • 40

Calculate the mean.

Mean: 16 + 17 + 19 + 20 + 20 + 21 + 23 + 24 + 25 + 25 + 25 + 26 + 26 + 27 + 27 + 27 + 28 + 29 + 30 + 32 + 33 + 33 + 34 + 35 + 37 + 39 + 40 = 738;

738 27 = 27.33

Got questions? Get instant answers now!

Identify the mode.

The most frequent lengths are 25 and 27, which occur three times. Mode = 25, 27

Got questions? Get instant answers now!


Use the following information to answer the next three exercises: Sixty-five randomly selected car salespersons were asked the number of cars they generally sell in one week. Fourteen people answered that they generally sell three cars; nineteen generally sell four cars; twelve generally sell five cars; nine generally sell six cars; eleven generally sell seven cars. Calculate the following:

sample mean = x = _______

Got questions? Get instant answers now!

Bringing it together

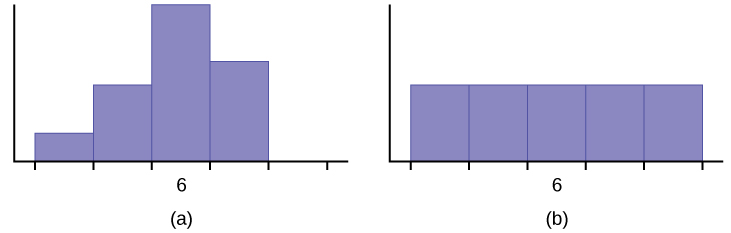
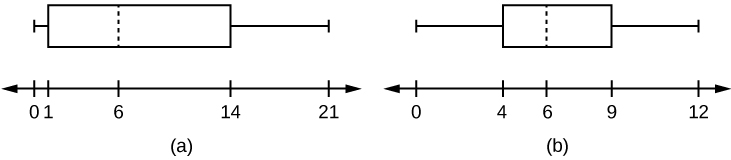
Javier and Ercilia are supervisors at a shopping mall. Each was given the task of estimating the mean distance that shoppers live from the mall. They each randomly surveyed 100 shoppers. The samples yielded the following information.

Javier Ercilia
x 6.0 miles 6.0 miles
s 4.0 miles 7.0 miles
  1. How can you determine which survey was correct ?
  2. Explain what the difference in the results of the surveys implies about the data.
  3. If the two histograms depict the distribution of values for each supervisor, which one depicts Ercilia's sample? How do you know?
    This shows two histograms. The first histogram shows a fairly symmetrical distribution with a mode of 6. The second histogram shows a uniform distribution.
  4. If the two box plots depict the distribution of values for each supervisor, which one depicts Ercilia’s sample? How do you know?
    This shows two horizontal boxplots. The first boxplot is graphed over a number line from 0 to 21. The first whisker extends from 0 to 1. The box begins at the first quartile, 1, and ends at the third quartile, 14. A vertical, dashed line marks the median at 6. The second whisker extends from the third quartile to the largest value, 21. The second boxplot is graphed over a number line from 0 to 12.  The first whisker extends from 0 to 4. The box begins at the first quartile, 4, and ends at the third quartile, 9. A vertical, dashed line marks the median at 6. The second whisker extends from the third quartile to the largest value, 12.
Got questions? Get instant answers now!

Use the following information to answer the next three exercises : We are interested in the number of years students in a particular elementary statistics class have lived in California. The information in the following table is from the entire section.

Number of years Frequency Number of years Frequency
Total = 20
7 1 22 1
14 3 23 1
15 1 26 1
18 1 40 2
19 4 42 2
20 3

What is the IQR ?

  1. 8
  2. 11
  3. 15
  4. 35

a

Got questions? Get instant answers now!

What is the mode?

  1. 19
  2. 19.5
  3. 14 and 20
  4. 22.65
Got questions? Get instant answers now!

Is this a sample or the entire population?

  1. sample
  2. entire population
  3. neither

b

Got questions? Get instant answers now!

Questions & Answers

start new n questions too
Emmaunella Reply
summarize halerambos & holbon
David Reply
the Three stages of Auguste Comte
Clementina Reply
what are agents of socialization
Antonio Reply
sociology of education
Nuhu Reply
definition of sociology of education
Nuhu
definition of sociology of education
Emmaunella
what is culture
Abdulrahim Reply
shared beliefs, values, and practices
AI-Robot
What are the two type of scientific method
ogunniran Reply
I'm willing to join you
Aceng Reply
what are the scientific method of sociology
Man
what is socialization
ogunniran Reply
the process wherein people come to understand societal norms and expectations, to accept society's beliefs, and to be aware of societal values
AI-Robot
scientific method in doing research
ogunniran
defimition of sickness in afica
Anita
Cosmology
ogunniran
Hmmm
ogunniran
list and explain the terms that found in society
REMMY Reply
list and explain the terms that found in society
Mukhtar
what are the agents of socialization
Antonio
Family Peer group Institution
Abdulwajud
I mean the definition
Antonio
ways of perceived deviance indifferent society
Naomi Reply
reasons of joining groups
SAM
to bring development to the nation at large
Hyellafiya
entails of consultative and consensus building from others
Gadama
World first Sociologist?
Abu
What is evolutionary model
Muhammad Reply
Evolution models refer to mathematical and computational representations of the processes involved in biological evolution. These models aim to simulate and understand how species change over time through mechanisms such as natural selection, genetic drift, and mutation. Evolutionary models can be u
faruk
what are the modern trends in religious behaviours
Selekeye Reply
what are social norms
Daniel Reply
shared standards of acceptable behavior by the group or appropriate behavior in a particular institution or those behaviors that are acceptable in a society
Lucius
that is how i understood it
Lucius
examples of societal norms
Diamond
Discuss the characteristics of the research located within positivist and the interpretivist paradigm
Tariro Reply
Got questions? Join the online conversation and get instant answers!
Jobilize.com Reply

Get Jobilize Job Search Mobile App in your pocket Now!

Get it on Google Play Download on the App Store Now


Source:  OpenStax, Introductory statistics. OpenStax CNX. May 06, 2016 Download for free at http://legacy.cnx.org/content/col11562/1.18
Google Play and the Google Play logo are trademarks of Google Inc.

Notification Switch

Would you like to follow the 'Introductory statistics' conversation and receive update notifications?

Ask