| << Chapter < Page | Chapter >> Page > |
Data from the Centers for Disease Control and Prevention.
Data from the National Center for HIV, STD, and TB Prevention.
The most basic type of association is a linear association. This type of relationship can be defined algebraically by the equations used, numerically with actual or predicted data values, or graphically from a plotted curve. (Lines are classified as straight curves.) Algebraically, a linear equation typically takes the form y = mx + b , where m and b are constants, x is the independent variable, y is the dependent variable. In a statistical context, a linear equation is written in the form y = a + bx , where a and b are the constants. This form is used to help readers distinguish the statistical context from the algebraic context. In the equation y = a + bx , the constant b that multiplies the x variable ( b is called a coefficient) is called as the slope . The slope describes the rate of change between the independent and dependent variables; in other words, the rate of change describes the change that occurs in the dependent variable as the independent variable is changed. In the equation y = a + bx , the constant a is called as the y -intercept. Graphically, the y -intercept is the y coordinate of the point where the graph of the line crosses the y axis. At this point x = 0.
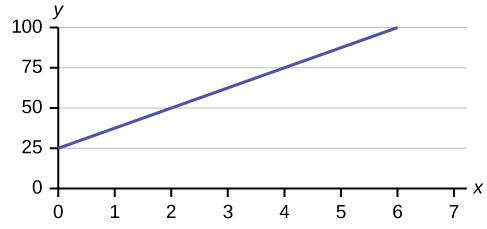
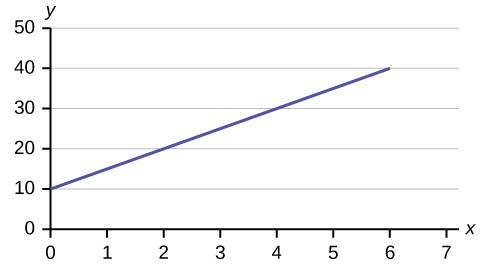
The slope of a line is a value that describes the rate of change between the independent and dependent variables. The slope tells us how the dependent variable ( y ) changes for every one unit increase in the independent ( x ) variable, on average. The y -intercept is used to describe the dependent variable when the independent variable equals zero. Graphically, the slope is represented by three line types in elementary statistics.
y = a + bx where a is the y -intercept and b is the slope. The variable x is the independent variable and y is the dependent variable.
Use the following information to answer the next three exercises . A vacation resort rents SCUBA equipment to certified divers. The resort charges an up-front fee of $25 and another fee of $12.50 an hour.
What are the dependent and independent variables?
dependent variable: fee amount; independent variable: time
Find the equation that expresses the total fee in terms of the number of hours the equipment is rented.
Use the following information to answer the next two exercises . A credit card company charges $10 when a payment is late, and $5 a day each day the payment remains unpaid.
Find the equation that expresses the total fee in terms of the number of days the payment is late.
Is the equation y = 10 + 5 x – 3 x 2 linear? Why or why not?
Which of the following equations are linear?
a. y = 6 x + 8
b. y + 7 = 3 x
c. y – x = 8 x 2
d. 4 y = 8
y = 6 x + 8, 4 y = 8, and y + 7 = 3 x are all linear equations.
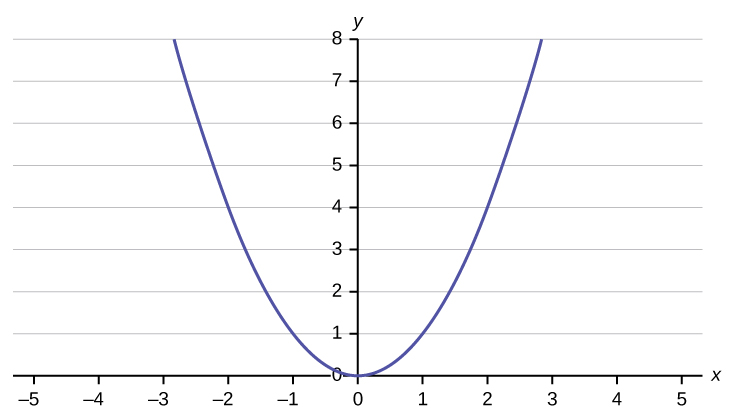
Does the graph show a linear equation? Why or why not?
[link] contains real data for the first two decades of AIDS reporting.
| Year | # AIDS cases diagnosed | # AIDS deaths |
| Pre-1981 | 91 | 29 |
| 1981 | 319 | 121 |
| 1982 | 1,170 | 453 |
| 1983 | 3,076 | 1,482 |
| 1984 | 6,240 | 3,466 |
| 1985 | 11,776 | 6,878 |
| 1986 | 19,032 | 11,987 |
| 1987 | 28,564 | 16,162 |
| 1988 | 35,447 | 20,868 |
| 1989 | 42,674 | 27,591 |
| 1990 | 48,634 | 31,335 |
| 1991 | 59,660 | 36,560 |
| 1992 | 78,530 | 41,055 |
| 1993 | 78,834 | 44,730 |
| 1994 | 71,874 | 49,095 |
| 1995 | 68,505 | 49,456 |
| 1996 | 59,347 | 38,510 |
| 1997 | 47,149 | 20,736 |
| 1998 | 38,393 | 19,005 |
| 1999 | 25,174 | 18,454 |
| 2000 | 25,522 | 17,347 |
| 2001 | 25,643 | 17,402 |
| 2002 | 26,464 | 16,371 |
| Total | 802,118 | 489,093 |
Use the columns "year" and "# AIDS cases diagnosed. Why is “year” the independent variable and “# AIDS cases diagnosed.” the dependent variable (instead of the reverse)?
The number of AIDS cases depends on the year. Therefore, year becomes the independent variable and the number of AIDS cases is the dependent variable.
Use the following information to answer the next two exercises . A specialty cleaning company charges an equipment fee and an hourly labor fee. A linear equation that expresses the total amount of the fee the company charges for each session is
y = 50 + 100
x .
What are the independent and dependent variables?
What is the y -intercept and what is the slope? Interpret them using complete sentences.
The y -intercept is 50 ( a = 50). At the start of the cleaning, the company charges a one-time fee of $50 (this is when x = 0). The slope is 100 ( b = 100). For each session, the company charges $100 for each hour they clean.
Use the following information to answer the next three questions . Due to erosion, a river shoreline is losing several thousand pounds of soil each year. A linear equation that expresses the total amount of soil lost per year is
y = 12,000
x .
What are the independent and dependent variables?
How many pounds of soil does the shoreline lose in a year?
12,000 pounds of soil
What is the y -intercept? Interpret its meaning.
Use the following information to answer the next two exercises . The price of a single issue of stock can fluctuate throughout the day. A linear equation that represents the price of stock for Shipment Express is
y = 15 – 1.5
x where
x is the number of hours passed in an eight-hour day of trading.
What are the slope and y -intercept? Interpret their meaning.
The slope is –1.5 ( b = –1.5). This means the stock is losing value at a rate of $1.50 per hour. The y -intercept is $15 ( a = 15). This means the price of stock before the trading day was $15.
If you owned this stock, would you want a positive or negative slope? Why?
Notification Switch
Would you like to follow the 'Introductory statistics' conversation and receive update notifications?

|
|
|
|
|

|
|

|
|

|
|

|
|
|
|
|

|
|

|
|

|
|

|
|

|