<< Chapter < Page Chapter >> Page >
The image shows radish plants of various heights sprouting out of dirt.
The heights of these radish plants are continuous random variables. (Credit: Rev Stan)

Chapter objectives

By the end of this chapter, the student should be able to:

  • Recognize and understand continuous probability density functions in general.
  • Recognize the uniform probability distribution and apply it appropriately.
  • Recognize the exponential probability distribution and apply it appropriately.

Continuous random variables have many applications. Baseball batting averages, IQ scores, the length of time a long distance telephone call lasts, the amount of money a person carries, the length of time a computer chip lasts, and SAT scores are just a few. The field of reliability depends on a variety of continuous random variables.

Note

The values of discrete and continuous random variables can be ambiguous. For example, if X is equal to the number of miles (to the nearest mile) you drive to work, then X is a discrete random variable. You count the miles. If X is the distance you drive to work, then you measure values of X and X is a continuous random variable. For a second example, if X is equal to the number of books in a backpack, then X is a discrete random variable. If X is the weight of a book, then X is a continuous random variable because weights are measured. How the random variable is defined is very important.

Properties of continuous probability distributions

The graph of a continuous probability distribution is a curve. Probability is represented by area under the curve.

The curve is called the probability density function (abbreviated as pdf ). We use the symbol f ( x ) to represent the curve. f ( x ) is the function that corresponds to the graph; we use the density function f ( x ) to draw the graph of the probability distribution.

Area under the curve is given by a different function called the cumulative distribution function (abbreviated as cdf ). The cumulative distribution function is used to evaluate probability as area.

  • The outcomes are measured, not counted.
  • The entire area under the curve and above the x-axis is equal to one.
  • Probability is found for intervals of x values rather than for individual x values.
  • P(c<x<d) is the probability that the random variable X is in the interval between the values c and d . P(c<x<d) is the area under the curve, above the x -axis, to the right of c and the left of d .
  • P(x = c) = 0 The probability that x takes on any single individual value is zero. The area below the curve, above the x -axis, and between x = c and x = c has no width, and therefore no area (area = 0). Since the probability is equal to the area, the probability is also zero.
  • P(c<x<d) is the same as P(c ≤ x ≤ d) because probability is equal to area.

We will find the area that represents probability by using geometry, formulas, technology, or probability tables. In general, calculus is needed to find the area under the curve for many probability density functions. When we use formulas to find the area in this textbook, the formulas were found by using the techniques of integral calculus. However, because most students taking this course have not studied calculus, we will not be using calculus in this textbook.

There are many continuous probability distributions. When using a continuous probability distribution to model probability, the distribution used is selected to model and fit the particular situation in the best way.

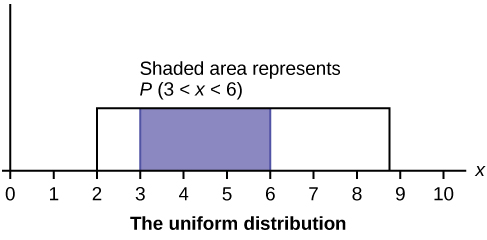
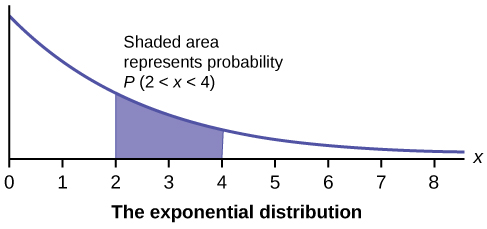
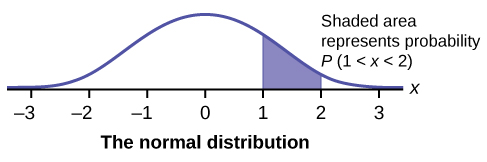
In this chapter and the next, we will study the uniform distribution, the exponential distribution, and the normal distribution. The following graphs illustrate these distributions.

This graph shows a uniform distribution. The horizontal axis ranges from 0 to 10. The distribution is modeled by a rectangle extending from x = 2 to x = 8.8. A region from x = 3 to x = 6 is shaded inside the rectangle. The shaded area represents P(3  x < 6).
The graph shows a Uniform Distribution with the area between x = 3 and x = 6 shaded to represent the probability that the value of the random variable X is in the interval between three and six.
The graph shows an Exponential Distribution with the area between x = 2 and x = 4 shaded to represent the probability that the value of the random variable X is in the interval between two and four.
This graph shows an exponential distribution. The graph slopes downward. It begins at a point on the y-axis and approaches the x-axis at the right edge of the graph. The region under the graph from x = 2 to x = 4 is shaded to represent P(2 < x < 4).
The graph shows the Standard Normal Distribution with the area between x = 1 and x = 2 shaded to represent the probability that the value of the random variable X is in the interval between one and two.

Questions & Answers

how does Neisseria cause meningitis
Nyibol Reply
what is microbiologist
Muhammad Reply
what is errata
Muhammad
is the branch of biology that deals with the study of microorganisms.
Ntefuni Reply
What is microbiology
Mercy Reply
studies of microbes
Louisiaste
when we takee the specimen which lumbar,spin,
Ziyad Reply
How bacteria create energy to survive?
Muhamad Reply
Bacteria doesn't produce energy they are dependent upon their substrate in case of lack of nutrients they are able to make spores which helps them to sustain in harsh environments
_Adnan
But not all bacteria make spores, l mean Eukaryotic cells have Mitochondria which acts as powerhouse for them, since bacteria don't have it, what is the substitution for it?
Muhamad
they make spores
Louisiaste
what is sporadic nd endemic, epidemic
Aminu Reply
the significance of food webs for disease transmission
Abreham
food webs brings about an infection as an individual depends on number of diseased foods or carriers dully.
Mark
explain assimilatory nitrate reduction
Esinniobiwa Reply
Assimilatory nitrate reduction is a process that occurs in some microorganisms, such as bacteria and archaea, in which nitrate (NO3-) is reduced to nitrite (NO2-), and then further reduced to ammonia (NH3).
Elkana
This process is called assimilatory nitrate reduction because the nitrogen that is produced is incorporated in the cells of microorganisms where it can be used in the synthesis of amino acids and other nitrogen products
Elkana
Examples of thermophilic organisms
Shu Reply
Give Examples of thermophilic organisms
Shu
advantages of normal Flora to the host
Micheal Reply
Prevent foreign microbes to the host
Abubakar
they provide healthier benefits to their hosts
ayesha
They are friends to host only when Host immune system is strong and become enemies when the host immune system is weakened . very bad relationship!
Mark
what is cell
faisal Reply
cell is the smallest unit of life
Fauziya
cell is the smallest unit of life
Akanni
ok
Innocent
cell is the structural and functional unit of life
Hasan
is the fundamental units of Life
Musa
what are emergency diseases
Micheal Reply
There are nothing like emergency disease but there are some common medical emergency which can occur simultaneously like Bleeding,heart attack,Breathing difficulties,severe pain heart stock.Hope you will get my point .Have a nice day ❣️
_Adnan
define infection ,prevention and control
Innocent
I think infection prevention and control is the avoidance of all things we do that gives out break of infections and promotion of health practices that promote life
Lubega
Heyy Lubega hussein where are u from?
_Adnan
en français
Adama
which site have a normal flora
ESTHER Reply
Many sites of the body have it Skin Nasal cavity Oral cavity Gastro intestinal tract
Safaa
skin
Asiina
skin,Oral,Nasal,GIt
Sadik
How can Commensal can Bacteria change into pathogen?
Sadik
How can Commensal Bacteria change into pathogen?
Sadik
all
Tesfaye
by fussion
Asiina
what are the advantages of normal Flora to the host
Micheal
what are the ways of control and prevention of nosocomial infection in the hospital
Micheal
what is inflammation
Shelly Reply
part of a tissue or an organ being wounded or bruised.
Wilfred
what term is used to name and classify microorganisms?
Micheal Reply
Binomial nomenclature
adeolu
Got questions? Join the online conversation and get instant answers!
Jobilize.com Reply
Practice Key Terms 2

Get Jobilize Job Search Mobile App in your pocket Now!

Get it on Google Play Download on the App Store Now


Source:  OpenStax, Introductory statistics. OpenStax CNX. May 06, 2016 Download for free at http://legacy.cnx.org/content/col11562/1.18
Google Play and the Google Play logo are trademarks of Google Inc.

Notification Switch

Would you like to follow the 'Introductory statistics' conversation and receive update notifications?

Ask