Use the arrow keys to navigate to the right of each equal sign (=) and clear them.
Repeat until all equations are deleted.
To draw default histogram:
Access the ZOOM menu.
Select
<9:ZoomStat> .
The histogram will show with a window automatically set.
To draw custom histogram:
Access window mode to set the graph parameters.
(width of bars)
(spacing of tick marks on
y -axis)
Access graphing mode to see the histogram.
To draw box plots:
Access graphing mode.
,
[STAT PLOT]
Select
<1:Plot 1> to access the first graph.
Use the arrows to select
<ON> and turn on Plot 1.
Use the arrows to select the box plot picture and enable it.
Use the arrows to navigate to
<Xlist> .
If "L1" is not selected, select it.
,
[L1] ,
Use the arrows to navigate to
<Freq> .
Indicate that the frequencies are in
[L2] .
,
[L2] ,
Go back to access other graphs.
,
[STAT PLOT]
Be sure to deselect or clear all equations before graphing using the method mentioned above.
View the box plot.
,
[STAT PLOT]
Linear regression
Sample data
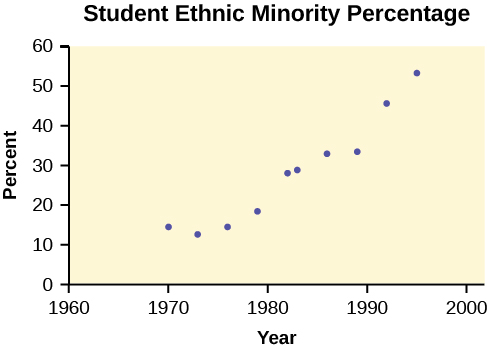
The following data is real. The percent of declared ethnic minority students at De Anza College for selected years from 1970–1995 was:
Year
Student Ethnic Minority Percentage
1970
14.13
1973
12.27
1976
14.08
1979
18.16
1982
27.64
1983
28.72
1986
31.86
1989
33.14
1992
45.37
1995
53.1
The independent variable is "Year," while the independent variable is "Student Ethnic Minority Percent."
Student ethnic minority percentage
By hand, verify the scatterplot above.
Note
The TI-83 has a built-in linear regression feature, which allows the data to be edited.The
x -values will be in
[L1] ; the
y -values in
[L2] .
To enter data and do linear regression:
ON Turns calculator on.
Before accessing this program, be sure to turn off all plots.
Access graphing mode.
,
[STAT PLOT]
Turn off all plots.
,
Round to three decimal places. To do so:
Access the mode menu.
,
[STAT PLOT]
Navigate to
<Float> and then to the right to
<3> .
All numbers will be rounded to three decimal places until changed.
Enter statistics mode and clear lists
[L1] and
[L2] , as describe previously.
,
Enter editing mode to insert values for
x and
y .
,
Enter each value. Press
to continue.
To display the correlation coefficient:
Access the catalog.
,
[CATALOG]
Arrow down and select
<DiagnosticOn> ... ,
,
and
will be displayed during regression calculations.
Access linear regression.
Select the form of
y =
a +
bx .
,
The display will show:
Linreg
y =
a +
bx
a = –3176.909
b = 1.617
r = 2 0.924
r = 0.961
This means the Line of Best Fit (Least Squares Line) is:
y = –3176.909 + 1.617
x
Percent = –3176.909 + 1.617 (year #)
The correlation coefficient
r = 0.961
To see the scatter plot:
Access graphing mode.
,
[STAT PLOT]
Select
<1:plot 1> To access plotting - first graph.
Navigate and select
<ON> to turn on Plot 1.
<ON>
Navigate to the first picture.
Select the scatter plot.
Navigate to
<Xlist> .
If
[L1] is not selected, press
,
[L1] to select it.
Confirm that the data values are in
[L1] .
<ON>
Navigate to
<Ylist> .
Select that the frequencies are in
[L2] .
,
[L2] ,
Go back to access other graphs.
,
[STAT PLOT]
Use the arrows to turn off the remaining plots.
Access window mode to set the graph parameters.
(spacing of tick marks on
x -axis)
(spacing of tick marks on
y -axis)
Be sure to deselect or clear all equations before graphing, using the instructions above.
Press the graph button to see the scatter plot.
Questions & Answers
Three charges q_{1}=+3\mu C, q_{2}=+6\mu C and q_{3}=+8\mu C are located at (2,0)m (0,0)m and (0,3) coordinates respectively. Find the magnitude and direction acted upon q_{2} by the two other charges.Draw the correct graphical illustration of the problem above showing the direction of all forces.
To solve this problem, we need to first find the net force acting on charge q_{2}. The magnitude of the force exerted by q_{1} on q_{2} is given by F=\frac{kq_{1}q_{2}}{r^{2}} where k is the Coulomb constant, q_{1} and q_{2} are the charges of the particles, and r is the distance between them.
Muhammed
What is the direction and net electric force on q_{1}= 5µC located at (0,4)r due to charges q_{2}=7mu located at (0,0)m and q_{3}=3\mu C located at (4,0)m?
Capacitor is a separation of opposite charges using an insulator of very small dimension between them. Capacitor is used for allowing an AC (alternating current) to pass while a DC (direct current) is blocked.
Gautam
A motor travelling at 72km/m on sighting a stop sign applying the breaks such that under constant deaccelerate in the meters of 50 metres what is the magnitude of the accelerate
velocity can be 72 km/h in question. 72 km/h=20 m/s, v^2=2.a.x , 20^2=2.a.50, a=4 m/s^2.
Mehmet
A boat travels due east at a speed of 40meter per seconds across a river flowing due south at 30meter per seconds. what is the resultant speed of the boat
which has a higher temperature, 1cup of boiling water or 1teapot of boiling water which can transfer more heat 1cup of boiling water or 1 teapot of boiling water explain your . answer
I believe temperature being an intensive property does not change for any amount of boiling water whereas heat being an extensive property changes with amount/size of the system.
Someone
Scratch that
Someone
temperature for any amount of water to boil at ntp is 100⁰C (it is a state function and and intensive property) and it depends both will give same amount of heat because the surface available for heat transfer is greater in case of the kettle as well as the heat stored in it but if you talk.....
Someone
about the amount of heat stored in the system then in that case since the mass of water in the kettle is greater so more energy is required to raise the temperature b/c more molecules of water are present in the kettle
pratica A on solution of hydro chloric acid,B is a solution containing 0.5000 mole ofsodium chlorid per dm³,put A in the burret and titrate 20.00 or 25.00cm³ portion of B using melting orange as the indicator. record the deside of your burret tabulate the burret reading and calculate the average volume of acid used?
No. According to Isac Newtons law. this two bodies maybe you and the wall beside you.
Attracting depends on the mass och each body and distance between them.
Dlovan
Are you really asking if two bodies have to be charged to be influenced by Coulombs Law?
Specific heat capacity is a measure of the amount of energy required to raise the temperature of a substance by one degree Celsius (or Kelvin). It is measured in Joules per kilogram per degree Celsius (J/kg°C).
AI-Robot
specific heat capacity is the amount of energy needed to raise the temperature of a substance by one degree Celsius or kelvin
ROKEEB
Got questions? Join the online conversation and get instant answers!