Class Time: __________________________
Name: _____________________________________
H
0 : _______
H
a : _______
In words,
CLEARLY state what your random variable
or
represents.
State the distribution to use for the test.
What is the test statistic?
What is the
p -value? In one or two complete sentences, explain what the
p -value means for this problem.
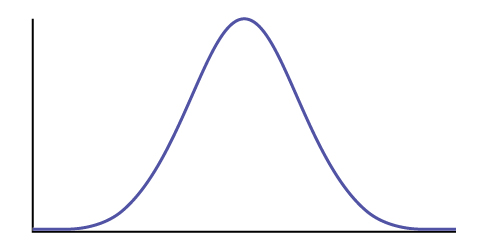
Use the previous information to sketch a picture of this situation. CLEARLY, label and scale the horizontal axis and shade the region(s) corresponding to the
p -value.
Indicate the correct decision (“reject” or “do not reject” the null hypothesis), the reason for it, and write an appropriate conclusion, using
complete sentences .
Alpha: _______
Decision: _______
Reason for decision: _______
Conclusion: _______
Construct a 95% confidence interval for the true mean or proportion. Include a sketch of the graph of the situation. Label the point estimate and the lower and upper bounds of the confidence interval.
Hypothesis testing with two samples
Class Time: __________________________
Name: _____________________________________
H
0 : _______
H
a : _______
In words,
clearly state what your random variable
,
or
represents.
State the distribution to use for the test.
What is the test statistic?
What is the
p -value? In one to two complete sentences, explain what the p-value means for this problem.
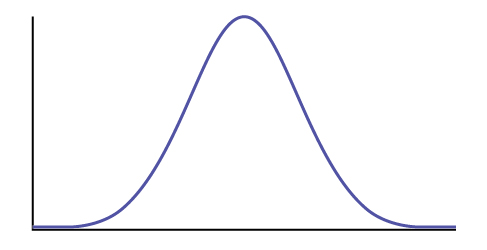
Use the previous information to sketch a picture of this situation.
CLEARLY label and scale the horizontal axis and shade the region(s) corresponding to the
p -value.
Indicate the correct decision (“reject” or “do not reject” the null hypothesis), the reason for it, and write an appropriate conclusion, using
complete sentences .
Alpha: _______
Decision: _______
Reason for decision: _______
Conclusion: _______
In complete sentences, explain how you determined which distribution to use.
The chi-square distribution
Class Time: __________________________
Name: ____________________________________
H
0 : _______
H
a : _______
What are the degrees of freedom?
State the distribution to use for the test.
What is the test statistic?
What is the
p -value? In one to two complete sentences, explain what the
p -value means for this problem.
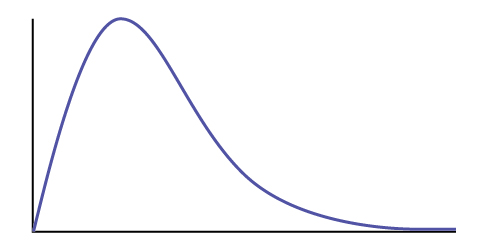
Use the previous information to sketch a picture of this situation.
Clearly label and scale the horizontal axis and shade the region(s) corresponding to the
p -value.
Indicate the correct decision (“reject” or “do not reject” the null hypothesis) and write appropriate conclusions, using
complete sentences.
Alpha: _______
Decision: _______
Reason for decision: _______
Conclusion: _______
F distribution and one-way anova
Class Time: __________________________
Name: ____________________________________
H
0 : _______
H
a : _______
df (
n ) = ______
df (
d ) = _______
State the distribution to use for the test.
What is the test statistic?
What is the
p -value?
Use the previous information to sketch a picture of this situation.
Clearly label and scale the horizontal axis and shade the region(s) corresponding to the
p -value.
Indicate the correct decision (“reject” or “do not reject” the null hypothesis) and write appropriate conclusions, using
complete sentences .
Step 1: Find the mean. To find the mean, add up all the scores, then divide them by the number of scores. ...
Step 2: Find each score's deviation from the mean. ...
Step 3: Square each deviation from the mean. ...
Step 4: Find the sum of squares. ...
Step 5: Divide the sum of squares by n – 1 or N.
The sample of 16 students is taken. The average age in the sample was 22 years with astandard deviation of 6 years. Construct a 95% confidence interval for the age of the population.
Bhartdarshan' is an internet-based travel agency wherein customer can see videos of the cities they plant to visit. The number of hits daily is a normally distributed random variable with a mean of 10,000 and a standard deviation of 2,400
a. what is the probability of getting more than 12,000 hits?
b. what is the probability of getting fewer than 9,000 hits?
Bhartdarshan'is an internet-based travel agency wherein customer can see videos of the cities they plan to visit. The number of hits daily is a normally distributed random variable with a mean of 10,000 and a standard deviation of 2,400.
a. What is the probability of getting more than 12,000 hits