Class Time: __________________________
Name: _____________________________________
H
0 : _______
H
a : _______
In words,
CLEARLY state what your random variable
or
represents.
State the distribution to use for the test.
What is the test statistic?
What is the
p -value? In one or two complete sentences, explain what the
p -value means for this problem.
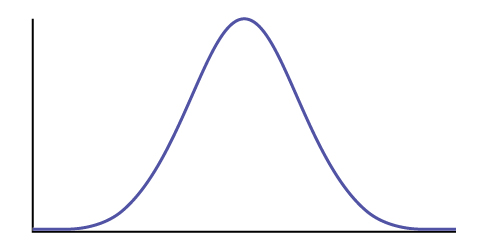
Use the previous information to sketch a picture of this situation. CLEARLY, label and scale the horizontal axis and shade the region(s) corresponding to the
p -value.
Indicate the correct decision (“reject” or “do not reject” the null hypothesis), the reason for it, and write an appropriate conclusion, using
complete sentences .
Alpha: _______
Decision: _______
Reason for decision: _______
Conclusion: _______
Construct a 95% confidence interval for the true mean or proportion. Include a sketch of the graph of the situation. Label the point estimate and the lower and upper bounds of the confidence interval.
Hypothesis testing with two samples
Class Time: __________________________
Name: _____________________________________
H
0 : _______
H
a : _______
In words,
clearly state what your random variable
,
or
represents.
State the distribution to use for the test.
What is the test statistic?
What is the
p -value? In one to two complete sentences, explain what the p-value means for this problem.
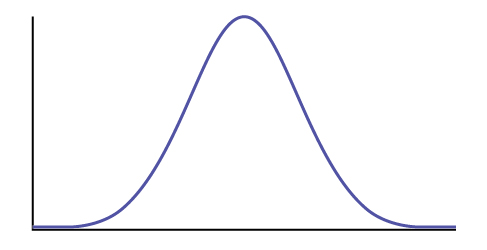
Use the previous information to sketch a picture of this situation.
CLEARLY label and scale the horizontal axis and shade the region(s) corresponding to the
p -value.
Indicate the correct decision (“reject” or “do not reject” the null hypothesis), the reason for it, and write an appropriate conclusion, using
complete sentences .
Alpha: _______
Decision: _______
Reason for decision: _______
Conclusion: _______
In complete sentences, explain how you determined which distribution to use.
The chi-square distribution
Class Time: __________________________
Name: ____________________________________
H
0 : _______
H
a : _______
What are the degrees of freedom?
State the distribution to use for the test.
What is the test statistic?
What is the
p -value? In one to two complete sentences, explain what the
p -value means for this problem.
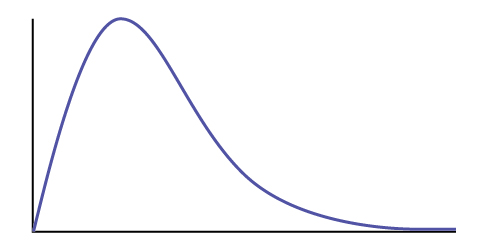
Use the previous information to sketch a picture of this situation.
Clearly label and scale the horizontal axis and shade the region(s) corresponding to the
p -value.
Indicate the correct decision (“reject” or “do not reject” the null hypothesis) and write appropriate conclusions, using
complete sentences.
Alpha: _______
Decision: _______
Reason for decision: _______
Conclusion: _______
F distribution and one-way anova
Class Time: __________________________
Name: ____________________________________
H
0 : _______
H
a : _______
df (
n ) = ______
df (
d ) = _______
State the distribution to use for the test.
What is the test statistic?
What is the
p -value?
Use the previous information to sketch a picture of this situation.
Clearly label and scale the horizontal axis and shade the region(s) corresponding to the
p -value.
Indicate the correct decision (“reject” or “do not reject” the null hypothesis) and write appropriate conclusions, using
complete sentences .
economics theory describes individual behavior as the result of a process of optimization under constraints the objective to be reached being determined by
Kalkidan
Economics is a branch of social science that deal with How to wise use of resource ,s
Kassie
need
WARKISA
Economic Needs: In economics, needs are goods or services that are necessary for maintaining a certain standard of living. This includes things like healthcare, education, and transportation.
Money market is a branch or segment of financial market where short-term debt instruments are traded upon. The instruments in this market includes Treasury bills, Bonds, Commercial Papers, Call money among other.
In economics, a perfect market refers to a theoretical construct where all participants have perfect information, goods are homogenous, there are no barriers to entry or exit, and prices are determined solely by supply and demand. It's an idealized model used for analysis,
Ezea
Got questions? Join the online conversation and get instant answers!