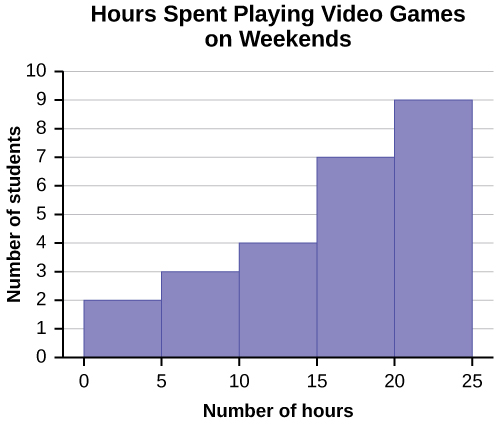
Fill in the blanks for the following sentence. Since the data consist of the numbers 1, 2, 3, and the starting point is 0.5, a width of one places the 1 in the middle of the interval 0.5 to _____, the 2 in the middle of the interval from _____ to _____, and the 3 in the middle of the interval from _____ to _____.
Number of Hours My Classmates Spent Playing Video Games on Weekends
9.95
10
2.25
16.75
0
19.5
22.5
7.5
15
12.75
5.5
11
10
20.75
17.5
23
21.9
24
23.75
18
20
15
22.9
18.8
20.5
Some values in this data set fall on boundaries for the class intervals. A value is counted in a class interval if it falls on the left boundary, but not if it falls on the right boundary. Different researchers may set up histograms for the same data in different ways. There is more than one correct way to set up a histogram.
Count the money (bills and change) in your pocket or purse. Your instructor will record the amounts. As a class, construct a histogram displaying the data. Discuss how many intervals you think is appropriate. You may want to experiment with the number of intervals.
Frequency polygons
Frequency polygons are analogous to line graphs, and just as line graphs make continuous data visually easy to interpret, so too do frequency polygons.
To construct a frequency polygon, first examine the data and decide on the number of intervals, or class intervals, to use on the
x -axis and
y -axis. After choosing the appropriate ranges, begin plotting the data points. After all the points are plotted, draw line segments to connect them.
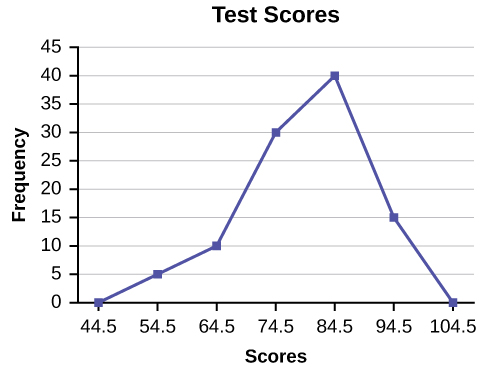
A frequency polygon was constructed from the frequency table below.
Frequency Distribution for Calculus Final Test Scores
Lower Bound
Upper Bound
Frequency
Cumulative Frequency
49.5
59.5
5
5
59.5
69.5
10
15
69.5
79.5
30
45
79.5
89.5
40
85
89.5
99.5
15
100
The first label on the
x -axis is 44.5. This represents an interval extending from 39.5 to 49.5. Since the lowest test score is 54.5, this interval is used only to allow the graph to touch the
x -axis. The point labeled 54.5 represents the next interval, or the first “real” interval from the table, and contains five scores. This reasoning is followed for each of the remaining intervals with the point 104.5 representing the interval from 99.5 to 109.5. Again, this interval contains no data and is only used so that the graph will touch the
x -axis. Looking at the graph, we say that this distribution is skewed because one side of the graph does not mirror the other side.
Bacteria doesn't produce energy they are dependent upon their substrate in case of lack of nutrients they are able to make spores which helps them to sustain in harsh environments
_Adnan
But not all bacteria make spores, l mean Eukaryotic cells have Mitochondria which acts as powerhouse for them, since bacteria don't have it, what is the substitution for it?
Assimilatory nitrate reduction is a process that occurs in some microorganisms, such as bacteria and archaea, in which nitrate (NO3-) is reduced to nitrite (NO2-), and then further reduced to ammonia (NH3).
Elkana
This process is called assimilatory nitrate reduction because the nitrogen that is produced is incorporated in the cells of microorganisms where it can be used in the synthesis of amino acids and other nitrogen products
There are nothing like emergency disease but there are some common medical emergency which can occur simultaneously like Bleeding,heart attack,Breathing difficulties,severe pain heart stock.Hope you will get my point .Have a nice day ❣️
_Adnan
define infection ,prevention and control
Innocent
I think infection prevention and control is the avoidance of all things we do that gives out break of infections and promotion of health practices that promote life