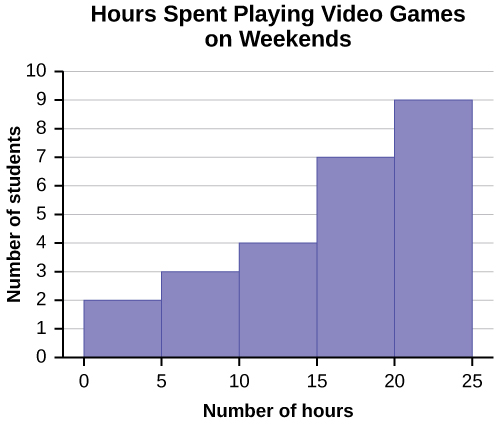
Fill in the blanks for the following sentence. Since the data consist of the numbers 1, 2, 3, and the starting point is 0.5, a width of one places the 1 in the middle of the interval 0.5 to _____, the 2 in the middle of the interval from _____ to _____, and the 3 in the middle of the interval from _____ to _____.
Number of Hours My Classmates Spent Playing Video Games on Weekends
9.95
10
2.25
16.75
0
19.5
22.5
7.5
15
12.75
5.5
11
10
20.75
17.5
23
21.9
24
23.75
18
20
15
22.9
18.8
20.5
Some values in this data set fall on boundaries for the class intervals. A value is counted in a class interval if it falls on the left boundary, but not if it falls on the right boundary. Different researchers may set up histograms for the same data in different ways. There is more than one correct way to set up a histogram.
Count the money (bills and change) in your pocket or purse. Your instructor will record the amounts. As a class, construct a histogram displaying the data. Discuss how many intervals you think is appropriate. You may want to experiment with the number of intervals.
Frequency polygons
Frequency polygons are analogous to line graphs, and just as line graphs make continuous data visually easy to interpret, so too do frequency polygons.
To construct a frequency polygon, first examine the data and decide on the number of intervals, or class intervals, to use on the
x -axis and
y -axis. After choosing the appropriate ranges, begin plotting the data points. After all the points are plotted, draw line segments to connect them.
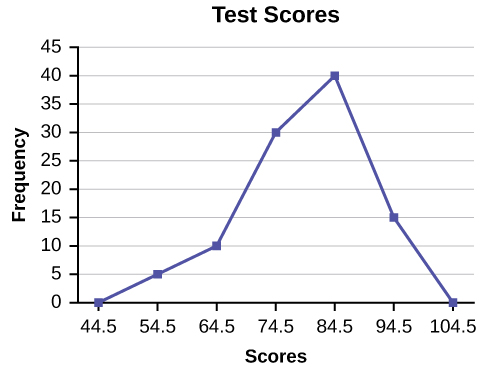
A frequency polygon was constructed from the frequency table below.
Frequency Distribution for Calculus Final Test Scores
Lower Bound
Upper Bound
Frequency
Cumulative Frequency
49.5
59.5
5
5
59.5
69.5
10
15
69.5
79.5
30
45
79.5
89.5
40
85
89.5
99.5
15
100
The first label on the
x -axis is 44.5. This represents an interval extending from 39.5 to 49.5. Since the lowest test score is 54.5, this interval is used only to allow the graph to touch the
x -axis. The point labeled 54.5 represents the next interval, or the first “real” interval from the table, and contains five scores. This reasoning is followed for each of the remaining intervals with the point 104.5 representing the interval from 99.5 to 109.5. Again, this interval contains no data and is only used so that the graph will touch the
x -axis. Looking at the graph, we say that this distribution is skewed because one side of the graph does not mirror the other side.
Communication is effective because it allows individuals to share ideas, thoughts, and information with others.
effective communication can lead to improved outcomes in various settings, including personal relationships, business environments, and educational settings. By communicating effectively, individuals can negotiate effectively, solve problems collaboratively, and work towards common goals.
it starts up serve and return practice/assessments.it helps find voice talking therapy also assessments through relaxed conversation.
miss
Every time someone flushes a toilet in the apartment building, the person begins to jumb back automatically after hearing the flush, before the water temperature changes. Identify the types of learning, if it is classical conditioning identify the NS, UCS, CS and CR. If it is operant conditioning, identify the type of consequence positive reinforcement, negative reinforcement or punishment
nature is an hereditary factor while nurture is an environmental factor which constitute an individual personality. so if an individual's parent has a deviant behavior and was also brought up in an deviant environment, observation of the behavior and the inborn trait we make the individual deviant.
Samuel
I am taking this course because I am hoping that I could somehow learn more about my chosen field of interest and due to the fact that being a PsyD really ignites my passion as an individual the more I hope to learn about developing and literally explore the complexity of my critical thinking skills
hello. autism is a umbrella term. autistic kids have different disorder overlapping. for example. a kid may show symptoms of ADHD and also learning disabilities.
before treatment please make sure the kid doesn't have physical disabilities like hearing..vision..speech problem. sometimes these
Jharna
continue..
sometimes due to these physical problems..the diagnosis may be misdiagnosed.
treatment for autism.
well it depends on the severity.
since autistic kids have problems in communicating and adopting to the environment.. it's best to expose the child in situations where the child
Jharna
child interact with other kids under doc supervision.
play therapy.
speech therapy.
Engaging in different activities that activate most parts of the brain.. like drawing..painting. matching color board game.
string and beads game.
the more you interact with the child the more effective
Jharna
results you'll get..
please consult a therapist to know what suits best on your child.
and last as a parent. I know sometimes it's overwhelming to guide a special kid.
but trust the process and be strong and patient as a parent.
Jharna
Got questions? Join the online conversation and get instant answers!