-
Home
- Introductory statistics
- Descriptive statistics
- Measures of the spread of the
where
Use the following information to answer the next two exercises : The following data are the distances between 20 retail stores and a large distribution center. The distances are in miles.
29; 37; 38; 40; 58; 67; 68; 69; 76; 86; 87; 95; 96; 96; 99; 106; 112; 127; 145; 150
Two baseball players, Fredo and Karl, on different teams wanted to find out who had the higher batting average when compared to his team. Which baseball player had the higher batting average when compared to his team?
| Baseball Player |
Batting Average |
Team Batting Average |
Team Standard Deviation |
| Fredo |
0.158 |
0.166 |
0.012 |
| Karl |
0.177 |
0.189 |
0.015 |
For Fredo:
z =
= –0.67
For Karl:
z =
= –0.8
Fredo’s
z -score of –0.67 is higher than Karl’s
z -score of –0.8. For batting average, higher values are better, so Fredo has a better batting average compared to his team.
Got questions? Get instant answers now!
Find the standard deviation for the following frequency tables using the formula. Check the calculations with the TI 83/84 .
Find the standard deviation for the following frequency tables using the formula. Check the calculations with the TI 83/84.
-
| Grade |
Frequency |
| 49.5–59.5 |
2 |
| 59.5–69.5 |
3 |
| 69.5–79.5 |
8 |
| 79.5–89.5 |
12 |
| 89.5–99.5 |
5 |
-
| Daily Low Temperature |
Frequency |
| 49.5–59.5 |
53 |
| 59.5–69.5 |
32 |
| 69.5–79.5 |
15 |
| 79.5–89.5 |
1 |
| 89.5–99.5 |
0 |
-
| Points per Game |
Frequency |
| 49.5–59.5 |
14 |
| 59.5–69.5 |
32 |
| 69.5–79.5 |
15 |
| 79.5–89.5 |
23 |
| 89.5–99.5 |
2 |
-
-
-
Got questions? Get instant answers now!
Bringing it together
Twenty-five randomly selected students were asked the number of movies they watched the previous week. The results are as follows:
| # of movies |
Frequency |
| 0 |
5 |
| 1 |
9 |
| 2 |
6 |
| 3 |
4 |
| 4 |
1 |
- Find the sample mean
.
- Find the approximate sample standard deviation,
s .
Got questions? Get instant answers now!
Forty randomly selected students were asked the number of pairs of sneakers they owned. Let
X = the number of pairs of sneakers owned. The results are as follows:
|
X |
Frequency |
| 1 |
2 |
| 2 |
5 |
| 3 |
8 |
| 4 |
12 |
| 5 |
12 |
| 6 |
0 |
| 7 |
1 |
- Find the sample mean
- Find the sample standard deviation,
s
- Construct a histogram of the data.
- Complete the columns of the chart.
- Find the first quartile.
- Find the median.
- Find the third quartile.
- Construct a box plot of the data.
- What percent of the students owned at least five pairs?
- Find the 40
th percentile.
- Find the 90
th percentile.
- Construct a line graph of the data
- Construct a stemplot of the data
Got questions? Get instant answers now!
Following are the published weights (in pounds) of all of the team members of the San Francisco 49ers from a previous year.
177; 205; 210; 210; 232; 205; 185; 185; 178; 210; 206; 212; 184; 174; 185; 242; 188; 212; 215; 247; 241; 223; 220; 260; 245; 259; 278; 270; 280; 295; 275; 285; 290; 272; 273; 280; 285; 286; 200; 215; 185; 230; 250; 241; 190; 260; 250; 302; 265; 290; 276; 228; 265
- Organize the data from smallest to largest value.
- Find the median.
- Find the first quartile.
- Find the third quartile.
- Construct a box plot of the data.
- The middle 50% of the weights are from _______ to _______.
- If our population were all professional football players, would the above data be a sample of weights or the population of weights? Why?
- If our population included every team member who ever played for the San Francisco 49ers, would the above data be a sample of weights or the population of weights? Why?
- Assume the population was the San Francisco 49ers. Find:
- the population mean,
μ .
- the population standard deviation,
σ .
- the weight that is two standard deviations below the mean.
- When Steve Young, quarterback, played football, he weighed 205 pounds. How many standard deviations above or below the mean was he?
- That same year, the mean weight for the Dallas Cowboys was 240.08 pounds with a standard deviation of 44.38 pounds. Emmit Smith weighed in at 209 pounds. With respect to his team, who was lighter, Smith or Young? How did you determine your answer?
- 174; 177; 178; 184; 185; 185; 185; 185; 188; 190; 200; 205; 205; 206; 210; 210; 210; 212; 212; 215; 215; 220; 223; 228; 230; 232; 241; 241; 242; 245; 247; 250; 250; 259; 260; 260; 265; 265; 270; 272; 273; 275; 276; 278; 280; 280; 285; 285; 286; 290; 290; 295; 302
- 241
- 205.5
- 272.5
-
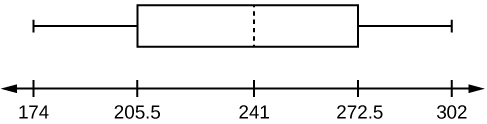
- 205.5, 272.5
- sample
- population
-
- 236.34
- 37.50
- 161.34
- 0.84 std. dev. below the mean
- Young
Got questions? Get instant answers now!
Questions & Answers
number of sport play by 50 student construct discrete data
width of the frangebany leaves on how to write a introduction
Solve the mean of variance
Step 1: Find the mean. To find the mean, add up all the scores, then divide them by the number of scores. ...
Step 2: Find each score's deviation from the mean. ...
Step 3: Square each deviation from the mean. ...
Step 4: Find the sum of squares. ...
Step 5: Divide the sum of squares by n – 1 or N.
kenneth
Is mistake done to something
Vutshila
What is the life teble
anas
statistics is the analyzing of data
how do you calculate mean
diveving the sum if all values
Shaynaynay
let A1,A2 and A3 events be independent,show that (A1)^c, (A2)^c and (A3)^c are independent?
data collected all over the world
Shaynaynay
construct a less than and more than table
The sample of 16 students is taken. The average age in the sample was 22 years with astandard deviation of 6 years. Construct a 95% confidence interval for the age of the population.
Bhartdarshan' is an internet-based travel agency wherein customer can see videos of the cities they plant to visit. The number of hits daily is a normally distributed random variable with a mean of 10,000 and a standard deviation of 2,400
a. what is the probability of getting more than 12,000 hits?
b. what is the probability of getting fewer than 9,000 hits?
Bhartdarshan'is an internet-based travel agency wherein customer can see videos of the cities they plan to visit. The number of hits daily is a normally distributed random variable with a mean of 10,000 and a standard deviation of 2,400.
a. What is the probability of getting more than 12,000 hits
Akshay
Sorry i want to learn more about this question
Bright
a= 0.20233
b=0.3384
Sufiyan
How do I interpret level of significance?
It depends on your business problem or in Machine Learning you could use ROC- AUC cruve to decide the threshold value
Shivam
how skewness and kurtosis are used in statistics
Source:
OpenStax, Introductory statistics. OpenStax CNX. May 06, 2016 Download for free at http://legacy.cnx.org/content/col11562/1.18
Google Play and the Google Play logo are trademarks of Google Inc.


