<< Chapter < Page Chapter >> Page >

Suppose the null hypothesis is true (the mean height of the loaves is no more than 15 cm). Then is the mean height (17 cm) calculated from the sample unexpectedly large? The hypothesis test works by asking the question how unlikely the sample mean would be if the null hypothesis were true. The graph shows how far out the sample mean is on the normal curve. The p -value is the probability that, if we were to take other samples, any other sample mean would fall at least as far out as 17 cm.

The p -value, then, is the probability that a sample mean is the same or greater than 17 cm. when the population mean is, in fact, 15 cm. We can calculate this probability using the normal distribution for means.
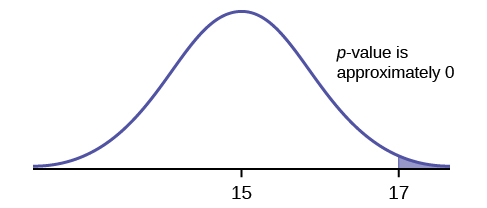
Normal distribution curve on average bread heights with values 15, as the population mean, and 17, as the point to determine the p-value, on the x-axis.

p -value= P ( x ¯ >17) which is approximately zero.

A p -value of approximately zero tells us that it is highly unlikely that a loaf of bread rises no more than 15 cm, on average. That is, almost 0% of all loaves of bread would be at least as high as 17 cm. purely by CHANCE had the population mean height really been 15 cm. Because the outcome of 17 cm. is so unlikely (meaning it is happening NOT by chance alone) , we conclude that the evidence is strongly against the null hypothesis (the mean height is at most 15 cm.). There is sufficient evidence that the true mean height for the population of the baker's loaves of bread is greater than 15 cm.

Try it

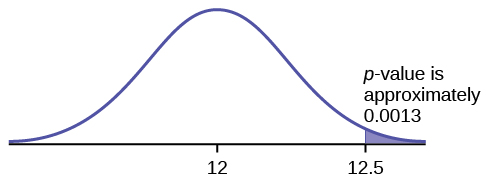
A normal distribution has a standard deviation of 1. We want to verify a claim that the mean is greater than 12. A sample of 36 is taken with a sample mean of 12.5.

H 0 : μ ≤ 12
H a : μ >12
The p -value is 0.0013
Draw a graph that shows the p -value.

p -value = 0.0013

Got questions? Get instant answers now!

Decision and conclusion

A systematic way to make a decision of whether to reject or not reject the null hypothesis is to compare the p -value and a preset or preconceived α (also called a "significance level") . A preset α is the probability of a Type I error (rejecting the null hypothesis when the null hypothesis is true). It may or may not be given to you at the beginning of the problem.

When you make a decision to reject or not reject H 0 , do as follows:

  • If α > p -value, reject H 0 . The results of the sample data are significant. There is sufficient evidence to conclude that H 0 is an incorrect belief and that the alternative hypothesis , H a , may be correct.
  • If α p -value, do not reject H 0 . The results of the sample data are not significant.There is not sufficient evidence to conclude that the alternative hypothesis, H a , may be correct.
  • When you "do not reject H 0 ", it does not mean that you should believe that H 0 is true. It simply means that the sample data have failed to provide sufficient evidence to cast serious doubt about the truthfulness of H o .

Conclusion: After you make your decision, write a thoughtful conclusion about the hypotheses in terms of the given problem.

When using the p -value to evaluate a hypothesis test, it is sometimes useful to use the following memory device

If the p -value is low, the null must go.

If the p -value is high, the null must fly.

This memory aid relates a p -value less than the established alpha (the p is low) as rejecting the null hypothesis and, likewise, relates a p -value higher than the established alpha (the p is high) as not rejecting the null hypothesis.

Fill in the blanks.

Reject the null hypothesis when ______________________________________.

The results of the sample data _____________________________________.

Do not reject the null when hypothesis when __________________________________________.

The results of the sample data ____________________________________________.

Reject the null hypothesis when the p -value is less than the established alpha value . The results of the sample data support the alternative hypothesis .

Do not reject the null hypothesis when the p -value is greater than the established alpha value . The results of the sample data do not support the alternative hypothesis .

Got questions? Get instant answers now!

Questions & Answers

A golfer on a fairway is 70 m away from the green, which sits below the level of the fairway by 20 m. If the golfer hits the ball at an angle of 40° with an initial speed of 20 m/s, how close to the green does she come?
Aislinn Reply
cm
tijani
what is titration
John Reply
what is physics
Siyaka Reply
A mouse of mass 200 g falls 100 m down a vertical mine shaft and lands at the bottom with a speed of 8.0 m/s. During its fall, how much work is done on the mouse by air resistance
Jude Reply
Can you compute that for me. Ty
Jude
what is the dimension formula of energy?
David Reply
what is viscosity?
David
what is inorganic
emma Reply
what is chemistry
Youesf Reply
what is inorganic
emma
Chemistry is a branch of science that deals with the study of matter,it composition,it structure and the changes it undergoes
Adjei
please, I'm a physics student and I need help in physics
Adjanou
chemistry could also be understood like the sexual attraction/repulsion of the male and female elements. the reaction varies depending on the energy differences of each given gender. + masculine -female.
Pedro
A ball is thrown straight up.it passes a 2.0m high window 7.50 m off the ground on it path up and takes 1.30 s to go past the window.what was the ball initial velocity
Krampah Reply
2. A sled plus passenger with total mass 50 kg is pulled 20 m across the snow (0.20) at constant velocity by a force directed 25° above the horizontal. Calculate (a) the work of the applied force, (b) the work of friction, and (c) the total work.
Sahid Reply
you have been hired as an espert witness in a court case involving an automobile accident. the accident involved car A of mass 1500kg which crashed into stationary car B of mass 1100kg. the driver of car A applied his brakes 15 m before he skidded and crashed into car B. after the collision, car A s
Samuel Reply
can someone explain to me, an ignorant high school student, why the trend of the graph doesn't follow the fact that the higher frequency a sound wave is, the more power it is, hence, making me think the phons output would follow this general trend?
Joseph Reply
Nevermind i just realied that the graph is the phons output for a person with normal hearing and not just the phons output of the sound waves power, I should read the entire thing next time
Joseph
Follow up question, does anyone know where I can find a graph that accuretly depicts the actual relative "power" output of sound over its frequency instead of just humans hearing
Joseph
"Generation of electrical energy from sound energy | IEEE Conference Publication | IEEE Xplore" ***ieeexplore.ieee.org/document/7150687?reload=true
Ryan
what's motion
Maurice Reply
what are the types of wave
Maurice
answer
Magreth
progressive wave
Magreth
hello friend how are you
Muhammad Reply
fine, how about you?
Mohammed
hi
Mujahid
A string is 3.00 m long with a mass of 5.00 g. The string is held taut with a tension of 500.00 N applied to the string. A pulse is sent down the string. How long does it take the pulse to travel the 3.00 m of the string?
yasuo Reply
Who can show me the full solution in this problem?
Reofrir Reply
Got questions? Join the online conversation and get instant answers!
Jobilize.com Reply

Get Jobilize Job Search Mobile App in your pocket Now!

Get it on Google Play Download on the App Store Now


Source:  OpenStax, Introductory statistics. OpenStax CNX. May 06, 2016 Download for free at http://legacy.cnx.org/content/col11562/1.18
Google Play and the Google Play logo are trademarks of Google Inc.

Notification Switch

Would you like to follow the 'Introductory statistics' conversation and receive update notifications?

Ask