<< Chapter < Page Chapter >> Page >

Chapter review

A tree diagram use branches to show the different outcomes of experiments and makes complex probability questions easy to visualize.

A Venn diagram is a picture that represents the outcomes of an experiment. It generally consists of a box that represents the sample space S together with circles or ovals. The circles or ovals represent events. A Venn diagram is especially helpful for visualizing the OR event, the AND event, and the complement of an event and for understanding conditional probabilities.

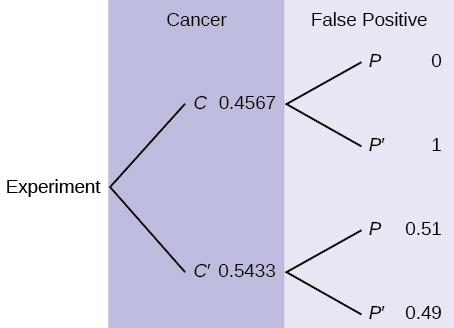
The probability that a man develops some form of cancer in his lifetime is 0.4567. The probability that a man has at least one false positive test result (meaning the test comes back for cancer when the man does not have it) is 0.51. Let: C = a man develops cancer in his lifetime; P = man has at least one false positive. Construct a tree diagram of the situation.

This is a tree diagram with two branches. The first branch, labeled Cancer, shows two lines: 0.4567 C and 0.5433 C'. The second branch is labeled False Positive. From C, there are two lines: 0 P and 1 P'. From C', there are two lines: 0.51 P and 0.49 P'.
Got questions? Get instant answers now!

Bringing it together

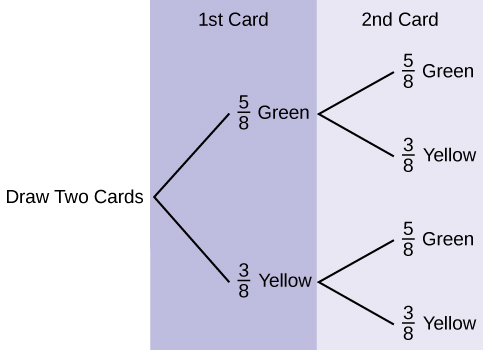
Use the following information to answer the next two exercises. Suppose that you have eight cards. Five are green and three are yellow. The cards are well shuffled.

Suppose that you randomly draw two cards, one at a time, with replacement .
Let G 1 = first card is green
Let G 2 = second card is green

  1. Draw a tree diagram of the situation.
  2. Find P ( G 1 AND G 2 ).
  3. Find P (at least one green).
  4. Find P ( G 2 | G 1 ).
  5. Are G 2 and G 1 independent events? Explain why or why not.
  1. This is a tree diagram with branches showing probabilities of each draw. The first branch shows two lines: 5/8 Green and 3/8 Yellow. The second branch has a set of two lines (5/8 Green and 3/8 Yellow) for each line of the first branch.
  2. P ( GG ) = ( 5 8 ) ( 5 8 ) = 25 64
  3. P (at least one green) = P ( GG ) + P ( GY ) + P ( YG ) = 25 64 + 15 64 + 15 64 = 55 64
  4. P ( G | G ) = 5 8
  5. Yes, they are independent because the first card is placed back in the bag before the second card is drawn; the composition of cards in the bag remains the same from draw one to draw two.
Got questions? Get instant answers now!

Suppose that you randomly draw two cards, one at a time, without replacement .
G 1 = first card is green
G 2 = second card is green

  1. Draw a tree diagram of the situation.
  2. Find P ( G 1 AND G 2 ).
  3. Find P (at least one green).
  4. Find P ( G 2 | G 1 ).
  5. Are G 2 and G 1 independent events? Explain why or why not.
Got questions? Get instant answers now!

Use the following information to answer the next two exercises. The percent of licensed U.S. drivers (from a recent year) that are female is 48.60. Of the females, 5.03% are age 19 and under; 81.36% are age 20–64; 13.61% are age 65 or over. Of the licensed U.S. male drivers, 5.04% are age 19 and under; 81.43% are age 20–64; 13.53% are age 65 or over.

Complete the following.

  1. Construct a table or a tree diagram of the situation.
  2. Find P (driver is female).
  3. Find P (driver is age 65 or over|driver is female).
  4. Find P (driver is age 65 or over AND female).
  5. In words, explain the difference between the probabilities in part c and part d.
  6. Find P (driver is age 65 or over).
  7. Are being age 65 or over and being female mutually exclusive events? How do you know?
  1. <20 20–64 >64 Totals
    Female 0.0244 0.3954 0.0661 0.486
    Male 0.0259 0.4186 0.0695 0.514
    Totals 0.0503 0.8140 0.1356 1
  2. P ( F ) = 0.486
  3. P (>64| F ) = 0.1361
  4. P (>64 and F ) = P ( F ) P (>64| F ) = (0.486)(0.1361) = 0.0661
  5. P (>64| F ) is the percentage of female drivers who are 65 or older and P (>64 and F ) is the percentage of drivers who are female and 65 or older.
  6. P (> 64 ) = P (>64 and F ) + P (>64 and M ) = 0.1356
  7. No, being female and 65 or older are not mutually exclusive because they can occur at the same time P(>64 and F ) = 0.0661.
Got questions? Get instant answers now!

Questions & Answers

Ayele, K., 2003. Introductory Economics, 3rd ed., Addis Ababa.
Widad Reply
can you send the book attached ?
Ariel
?
Ariel
What is economics
Widad Reply
the study of how humans make choices under conditions of scarcity
AI-Robot
U(x,y) = (x×y)1/2 find mu of x for y
Desalegn Reply
U(x,y) = (x×y)1/2 find mu of x for y
Desalegn
what is ecnomics
Jan Reply
this is the study of how the society manages it's scarce resources
Belonwu
what is macroeconomic
John Reply
macroeconomic is the branch of economics which studies actions, scale, activities and behaviour of the aggregate economy as a whole.
husaini
etc
husaini
difference between firm and industry
husaini Reply
what's the difference between a firm and an industry
Abdul
firm is the unit which transform inputs to output where as industry contain combination of firms with similar production 😅😅
Abdulraufu
Suppose the demand function that a firm faces shifted from Qd  120 3P to Qd  90  3P and the supply function has shifted from QS  20  2P to QS 10  2P . a) Find the effect of this change on price and quantity. b) Which of the changes in demand and supply is higher?
Toofiq Reply
explain standard reason why economic is a science
innocent Reply
factors influencing supply
Petrus Reply
what is economic.
Milan Reply
scares means__________________ends resources. unlimited
Jan
economics is a science that studies human behaviour as a relationship b/w ends and scares means which have alternative uses
Jan
calculate the profit maximizing for demand and supply
Zarshad Reply
Why qualify 28 supplies
Milan
what are explicit costs
Nomsa Reply
out-of-pocket costs for a firm, for example, payments for wages and salaries, rent, or materials
AI-Robot
concepts of supply in microeconomics
David Reply
economic overview notes
Amahle Reply
identify a demand and a supply curve
Salome Reply
i don't know
Parul
there's a difference
Aryan
Demand curve shows that how supply and others conditions affect on demand of a particular thing and what percent demand increase whith increase of supply of goods
Israr
Hi Sir please how do u calculate Cross elastic demand and income elastic demand?
Abari
Got questions? Join the online conversation and get instant answers!
Jobilize.com Reply

Get Jobilize Job Search Mobile App in your pocket Now!

Get it on Google Play Download on the App Store Now


Source:  OpenStax, Introductory statistics. OpenStax CNX. May 06, 2016 Download for free at http://legacy.cnx.org/content/col11562/1.18
Google Play and the Google Play logo are trademarks of Google Inc.

Notification Switch

Would you like to follow the 'Introductory statistics' conversation and receive update notifications?

Ask