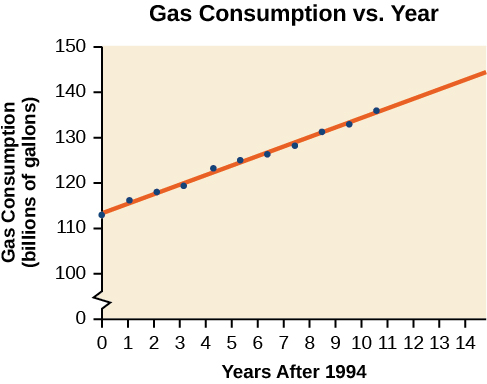
Gasoline consumption in the United States has been steadily increasing. Consumption data from 1994 to 2004 is shown in
[link]http://www.bts.gov/publications/national_transportation_statistics/2005/html/table_04_10.html . Determine whether the trend is linear, and if so, find a model for the data. Use the model to predict the consumption in 2008.
Year
'94
'95
'96
'97
'98
'99
'00
'01
'02
'03
'04
Consumption (billions of gallons)
113
116
118
119
123
125
126
128
131
133
136
The scatter plot of the data, including the least squares regression line, is shown in
[link] .
We can introduce new input variable,
representing years since 1994.
The least squares regression equation is:
Using technology, the correlation coefficient was calculated to be 0.9965, suggesting a very strong increasing linear trend.
Using this to predict consumption in 2008
The model predicts 144.244 billion gallons of gasoline consumption in 2008.
Visit
this website for additional practice questions from Learningpod.
Key concepts
Scatter plots show the relationship between two sets of data. See
[link] .
Scatter plots may represent linear or non-linear models.
The line of best fit may be estimated or calculated, using a calculator or statistical software. See
[link] .
Interpolation can be used to predict values inside the domain and range of the data, whereas extrapolation can be used to predict values outside the domain and range of the data. See
[link] .
The correlation coefficient,
indicates the degree of linear relationship between data. See
[link] .
A regression line best fits the data. See
[link] .
The least squares regression line is found by minimizing the squares of the distances of points from a line passing through the data and may be used to make predictions regarding either of the variables. See
[link] .
Section exercises
Verbal
Describe what it means if there is a model breakdown when using a linear model.
When our model no longer applies, after some value in the domain, the model itself doesn’t hold.
A regression was run to determine whether there is a relationship between hours of TV watched per day
and number of sit-ups a person can do
The results of the regression are given below. Use this to predict the number of sit-ups a person who watches 11 hours of TV can do.
The lymphatic system plays several crucial roles in the human body, functioning as a key component of the immune system and contributing to the maintenance of fluid balance. Its main functions include:
1. Immune Response: The lymphatic system produces and transports lymphocytes, which are a type of
asegid
to transport fluids fats proteins and lymphocytes to the blood stream as lymph
Anatomy is the study of the structure of the body, while physiology is the study of the function of the body. Anatomy looks at the body's organs and systems, while physiology looks at how those organs and systems work together to keep the body functioning.
Enzymes are proteins that help speed up chemical reactions in our bodies. Enzymes are essential for digestion, liver function and much more. Too much or too little of a certain enzyme can cause health problems
Kamara
yes
Prince
how does the stomach protect itself from the damaging effects of HCl
the normal temperature is 37°c or 98.6 °Fahrenheit is important for maintaining the homeostasis in the body
the body regular this temperature through the process called thermoregulation which involves brain skin muscle and other organ working together to maintain stable internal temperature