Many applications of the derivative involve determining the rate of change at a given instant of a function with the independent variable time—which is why the term
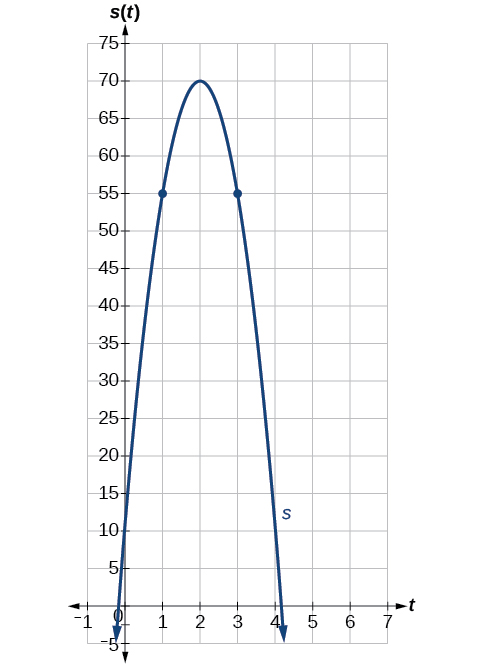
instantaneous is used. Consider the height of a ball tossed upward with an initial velocity of 64 feet per second, given by
where
is measured in seconds and
is measured in feet. We know the path is that of a parabola. The derivative will tell us how the height is changing at any given point in time. The height of the ball is shown in
[link] as a function of time. In physics, we call this the “
s -
t graph.”
Finding the instantaneous rate of change
Using the function above,
what is the instantaneous velocity of the ball at 1 second and 3 seconds into its flight?
The velocity at
and
is the instantaneous rate of change of distance per time, or velocity. Notice that the initial height is 6 feet. To find the instantaneous velocity, we find the
derivative and evaluate it at
and
For any value of
,
tells us the velocity at that value of
Evaluate
and
The velocity of the ball after 1 second is 32 feet per second, as it is on the way up.
The velocity of the ball after 3 seconds is
feet per second, as it is on the way down.
Using graphs to find instantaneous rates of change
We can estimate an instantaneous rate of change at
by observing the slope of the curve of the function
at
We do this by drawing a line tangent to the function at
and finding its slope.
Given a graph of a function
find the instantaneous rate of change of the function at
Locate
on the graph of the function
Draw a tangent line, a line that goes through
at
and at no other point in that section of the curve. Extend the line far enough to calculate its slope as
Estimating the derivative at a point on the graph of a function
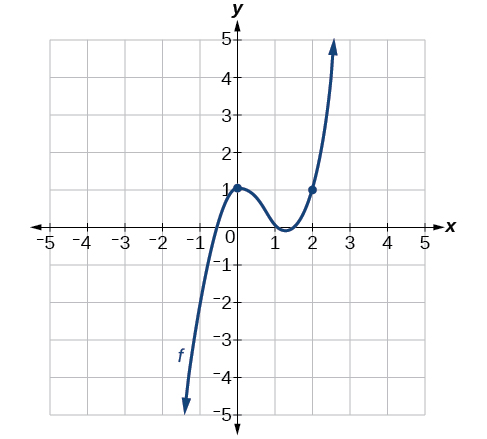
From the graph of the function
presented in
[link] , estimate each of the following:
To find the functional value,
find the
y -coordinate at
To find the
derivative at
draw a tangent line at
and estimate the slope of that tangent line. See
[link] .
is the
y -coordinate at
The point has coordinates
thus
is the
y -coordinate at
The point has coordinates
thus
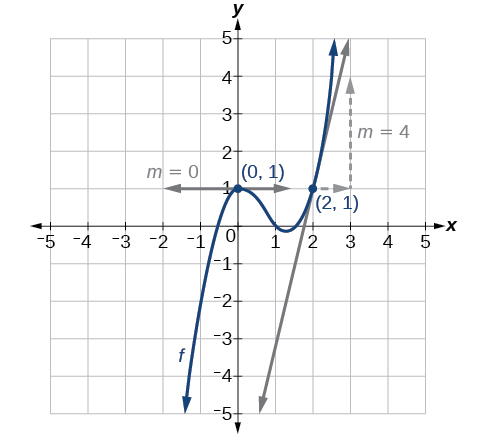
is found by estimating the slope of the tangent line to the curve at
The tangent line to the curve at
appears horizontal. Horizontal lines have a slope of 0, thus
is found by estimating the slope of the tangent line to the curve at
Observe the path of the tangent line to the curve at
As the
value moves one unit to the right, the
value moves up four units to another point on the line. Thus, the slope is 4, so
Step 1: Find the mean. To find the mean, add up all the scores, then divide them by the number of scores. ...
Step 2: Find each score's deviation from the mean. ...
Step 3: Square each deviation from the mean. ...
Step 4: Find the sum of squares. ...
Step 5: Divide the sum of squares by n – 1 or N.
The sample of 16 students is taken. The average age in the sample was 22 years with astandard deviation of 6 years. Construct a 95% confidence interval for the age of the population.
Bhartdarshan' is an internet-based travel agency wherein customer can see videos of the cities they plant to visit. The number of hits daily is a normally distributed random variable with a mean of 10,000 and a standard deviation of 2,400
a. what is the probability of getting more than 12,000 hits?
b. what is the probability of getting fewer than 9,000 hits?
Bhartdarshan'is an internet-based travel agency wherein customer can see videos of the cities they plan to visit. The number of hits daily is a normally distributed random variable with a mean of 10,000 and a standard deviation of 2,400.
a. What is the probability of getting more than 12,000 hits