<< Chapter < Page Chapter >> Page >

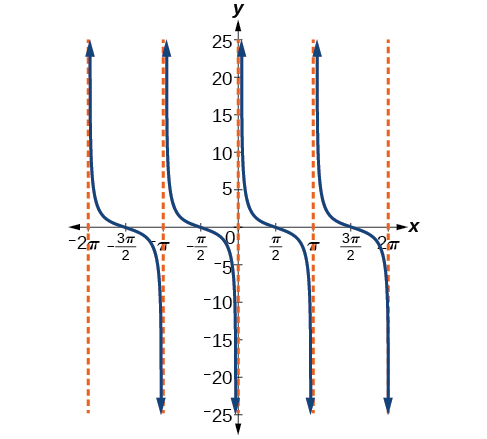
The cotangent graph has vertical asymptotes at each value of x where tan x = 0 ; we show these in the graph below with dashed lines. Since the cotangent is the reciprocal of the tangent, cot x has vertical asymptotes at all values of x where tan x = 0 , and cot x = 0 at all values of x where tan x has its vertical asymptotes.

A graph of cotangent of x, with vertical asymptotes at multiples of pi.
The cotangent function

Features of the graph of y = A Cot( Bx )

  • The stretching factor is | A | .
  • The period is P = π | B | .
  • The domain is x π | B | k , where k is an integer.
  • The range is ( , ) .
  • The asymptotes occur at x = π | B | k , where k is an integer.
  • y = A cot ( B x ) is an odd function.

Graphing variations of y = cot x

We can transform the graph of the cotangent in much the same way as we did for the tangent. The equation becomes the following.

y = A cot ( B x C ) + D

Properties of the graph of y = A Cot( Bx −c)+ D

  • The stretching factor is | A | .
  • The period is π | B | .
  • The domain is x C B + π | B | k , where k is an integer.
  • The range is ( −∞ , | A | ] [ | A | , ) .
  • The vertical asymptotes occur at x = C B + π | B | k , where k is an integer.
  • There is no amplitude.
  • y = A cot ( B x ) is an odd function because it is the quotient of even and odd functions (cosine and sine, respectively)

Given a modified cotangent function of the form f ( x ) = A cot ( B x ) , graph one period.

  1. Express the function in the form f ( x ) = A cot ( B x ) .
  2. Identify the stretching factor, | A | .
  3. Identify the period, P = π | B | .
  4. Draw the graph of y = A tan ( B x ) .
  5. Plot any two reference points.
  6. Use the reciprocal relationship between tangent and cotangent to draw the graph of y = A cot ( B x ) .
  7. Sketch the asymptotes.

Graphing variations of the cotangent function

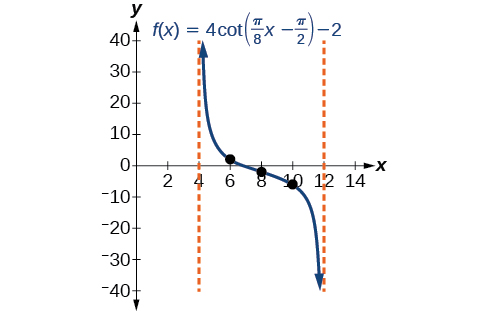
Determine the stretching factor, period, and phase shift of y = 3 cot ( 4 x ) , and then sketch a graph.

  • Step 1. Expressing the function in the form f ( x ) = A cot ( B x ) gives f ( x ) = 3 cot ( 4 x ) .
  • Step 2. The stretching factor is | A | = 3.
  • Step 3. The period is P = π 4 .
  • Step 4. Sketch the graph of y = 3 tan ( 4 x ) .
  • Step 5. Plot two reference points. Two such points are ( π 16 , 3 ) and ( 3 π 16 , −3 ) .
  • Step 6. Use the reciprocal relationship to draw y = 3 cot ( 4 x ) .
  • Step 7. Sketch the asymptotes,
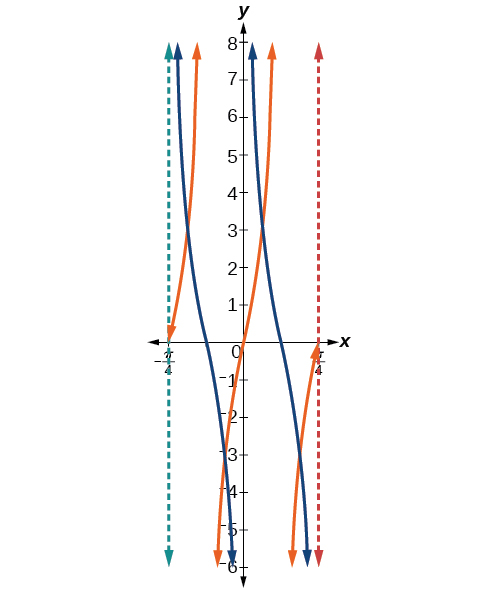
 x = 0 , x = π 4 .

The orange graph in [link] shows y = 3 tan ( 4 x ) and the blue graph shows y = 3 cot ( 4 x ) .

A graph of two periods of a modified tangent function and a modified cotangent function. Vertical asymptotes at x=-pi/4 and pi/4.
Got questions? Get instant answers now!

Given a modified cotangent function of the form f ( x ) = A cot ( B x C ) + D , graph one period.

  1. Express the function in the form f ( x ) = A cot ( B x C ) + D .
  2. Identify the stretching factor, | A | .
  3. Identify the period, P = π | B | .
  4. Identify the phase shift, C B .
  5. Draw the graph of y = A tan ( B x ) shifted to the right by C B and up by D .
  6. Sketch the asymptotes x = C B + π | B | k , where k is an integer.
  7. Plot any three reference points and draw the graph through these points.

Graphing a modified cotangent

Sketch a graph of one period of the function f ( x ) = 4 cot ( π 8 x π 2 ) 2.

  • Step 1. The function is already written in the general form f ( x ) = A cot ( B x C ) + D .
  • Step 2. A = 4 , so the stretching factor is 4.
  • Step 3. B = π 8 , so the period is P = π | B | = π π 8 = 8.
  • Step 4. C = π 2 , so the phase shift is C B = π 2 π 8 = 4.
  • Step 5. We draw f ( x ) = 4 tan ( π 8 x π 2 ) 2.
  • Step 6-7. Three points we can use to guide the graph are ( 6 , 2 ) , ( 8 , 2 ) , and ( 10 , 6 ) . We use the reciprocal relationship of tangent and cotangent to draw f ( x ) = 4 cot ( π 8 x π 2 ) 2.
  • Step 8. The vertical asymptotes are x = 4 and x = 12.

The graph is shown in [link] .

A graph of one period of a modified cotangent function. Vertical asymptotes at x=4 and x=12.
One period of a modified cotangent function
Got questions? Get instant answers now!

Questions & Answers

what does mean opportunity cost?
Aster Reply
what is poetive effect of population growth
Solomon Reply
what is inflation
Nasir Reply
what is demand
Eleni
what is economics
IMLAN Reply
economics theory describes individual behavior as the result of a process of optimization under constraints the objective to be reached being determined by
Kalkidan
Economics is a branch of social science that deal with How to wise use of resource ,s
Kassie
need
WARKISA
Economic Needs: In economics, needs are goods or services that are necessary for maintaining a certain standard of living. This includes things like healthcare, education, and transportation.
Kalkidan
What is demand and supply
EMPEROR Reply
deman means?
Alex
what is supply?
Alex
ex play supply?
Alex
Money market is a branch or segment of financial market where short-term debt instruments are traded upon. The instruments in this market includes Treasury bills, Bonds, Commercial Papers, Call money among other.
murana Reply
good
Kayode
what is money market
umar Reply
Examine the distinction between theory of comparative cost Advantage and theory of factor proportion
Fatima Reply
What is inflation
Bright Reply
a general and ongoing rise in the level of prices in an economy
AI-Robot
What are the factors that affect demand for a commodity
Florence Reply
price
Kenu
differentiate between demand and supply giving examples
Lambiv Reply
differentiated between demand and supply using examples
Lambiv
what is labour ?
Lambiv
how will I do?
Venny Reply
how is the graph works?I don't fully understand
Rezat Reply
information
Eliyee
devaluation
Eliyee
t
WARKISA
hi guys good evening to all
Lambiv
multiple choice question
Aster Reply
appreciation
Eliyee
explain perfect market
Lindiwe Reply
In economics, a perfect market refers to a theoretical construct where all participants have perfect information, goods are homogenous, there are no barriers to entry or exit, and prices are determined solely by supply and demand. It's an idealized model used for analysis,
Ezea
Got questions? Join the online conversation and get instant answers!
Jobilize.com Reply

Get Jobilize Job Search Mobile App in your pocket Now!

Get it on Google Play Download on the App Store Now


Source:  OpenStax, Precalculus. OpenStax CNX. Jan 19, 2016 Download for free at https://legacy.cnx.org/content/col11667/1.6
Google Play and the Google Play logo are trademarks of Google Inc.

Notification Switch

Would you like to follow the 'Precalculus' conversation and receive update notifications?

Ask