<< Chapter < Page Chapter >> Page >
In this section, you will:
  • Graph linear functions.
  • Write the equation for a linear function from the graph of a line.
  • Given the equations of two lines, determine whether their graphs are parallel or perpendicular.
  • Write the equation of a line parallel or perpendicular to a given line.
  • Solve a system of linear equations.

Two competing telephone companies offer different payment plans. The two plans charge the same rate per long distance minute, but charge a different monthly flat fee. A consumer wants to determine whether the two plans will ever cost the same amount for a given number of long distance minutes used. The total cost of each payment plan can be represented by a linear function. To solve the problem, we will need to compare the functions. In this section, we will consider methods of comparing functions using graphs.

Graphing linear functions

In Linear Functions , we saw that that the graph of a linear function is a straight line. We were also able to see the points of the function as well as the initial value from a graph. By graphing two functions, then, we can more easily compare their characteristics.

There are three basic methods of graphing linear functions. The first is by plotting points and then drawing a line through the points. The second is by using the y- intercept and slope. And the third is by using transformations of the identity function f ( x ) = x .

Graphing a function by plotting points

To find points of a function, we can choose input values, evaluate the function at these input values, and calculate output values. The input values and corresponding output values form coordinate pairs. We then plot the coordinate pairs on a grid. In general, we should evaluate the function at a minimum of two inputs in order to find at least two points on the graph. For example, given the function, f ( x ) = 2 x , we might use the input values 1 and 2. Evaluating the function for an input value of 1 yields an output value of 2, which is represented by the point ( 1 , 2 ) . Evaluating the function for an input value of 2 yields an output value of 4, which is represented by the point ( 2 , 4 ) . Choosing three points is often advisable because if all three points do not fall on the same line, we know we made an error.

Given a linear function, graph by plotting points.
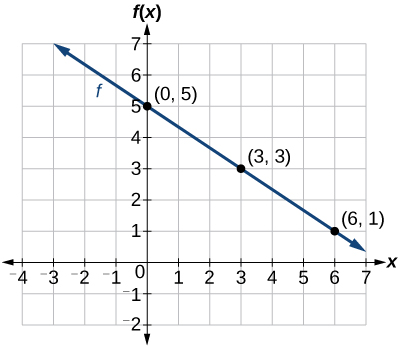
  1. Choose a minimum of two input values.
  2. Evaluate the function at each input value.
  3. Use the resulting output values to identify coordinate pairs.
  4. Plot the coordinate pairs on a grid.
  5. Draw a line through the points.

Graphing by plotting points

Graph f ( x ) = 2 3 x + 5 by plotting points.

Begin by choosing input values. This function includes a fraction with a denominator of 3, so let’s choose multiples of 3 as input values. We will choose 0, 3, and 6.

Evaluate the function at each input value, and use the output value to identify coordinate pairs.

x = 0 f ( 0 ) = 2 3 ( 0 ) + 5 = 5 ( 0 , 5 ) x = 3 f ( 3 ) = 2 3 ( 3 ) + 5 = 3 ( 3 , 3 ) x = 6 f ( 6 ) = 2 3 ( 6 ) + 5 = 1 ( 6 , 1 )

Plot the coordinate pairs and draw a line through the points. [link] represents the graph of the function f ( x ) = 2 3 x + 5.

The graph of the linear function f ( x ) = 2 3 x + 5.
Got questions? Get instant answers now!

Questions & Answers

what does mean opportunity cost?
Aster Reply
what is poetive effect of population growth
Solomon Reply
what is inflation
Nasir Reply
what is demand
Eleni
what is economics
IMLAN Reply
economics theory describes individual behavior as the result of a process of optimization under constraints the objective to be reached being determined by
Kalkidan
Economics is a branch of social science that deal with How to wise use of resource ,s
Kassie
need
WARKISA
Economic Needs: In economics, needs are goods or services that are necessary for maintaining a certain standard of living. This includes things like healthcare, education, and transportation.
Kalkidan
What is demand and supply
EMPEROR Reply
deman means?
Alex
what is supply?
Alex
ex play supply?
Alex
Money market is a branch or segment of financial market where short-term debt instruments are traded upon. The instruments in this market includes Treasury bills, Bonds, Commercial Papers, Call money among other.
murana Reply
good
Kayode
what is money market
umar Reply
Examine the distinction between theory of comparative cost Advantage and theory of factor proportion
Fatima Reply
What is inflation
Bright Reply
a general and ongoing rise in the level of prices in an economy
AI-Robot
What are the factors that affect demand for a commodity
Florence Reply
price
Kenu
differentiate between demand and supply giving examples
Lambiv Reply
differentiated between demand and supply using examples
Lambiv
what is labour ?
Lambiv
how will I do?
Venny Reply
how is the graph works?I don't fully understand
Rezat Reply
information
Eliyee
devaluation
Eliyee
t
WARKISA
hi guys good evening to all
Lambiv
multiple choice question
Aster Reply
appreciation
Eliyee
explain perfect market
Lindiwe Reply
In economics, a perfect market refers to a theoretical construct where all participants have perfect information, goods are homogenous, there are no barriers to entry or exit, and prices are determined solely by supply and demand. It's an idealized model used for analysis,
Ezea
Got questions? Join the online conversation and get instant answers!
Jobilize.com Reply
Practice Key Terms 5

Get Jobilize Job Search Mobile App in your pocket Now!

Get it on Google Play Download on the App Store Now


Source:  OpenStax, Precalculus. OpenStax CNX. Jan 19, 2016 Download for free at https://legacy.cnx.org/content/col11667/1.6
Google Play and the Google Play logo are trademarks of Google Inc.

Notification Switch

Would you like to follow the 'Precalculus' conversation and receive update notifications?

Ask