<< Chapter < Page Chapter >> Page >
In this section, you will:
  • Determine the amplitude and period of sinusoidal functions.
  • Model equations and graph sinusoidal functions.
  • Model periodic behavior.
  • Model harmonic motion functions.
Photo of the top part of a clock.
The hands on a clock are periodic: they repeat positions every twelve hours. (credit: “zoutedrop”/Flickr)

Suppose we charted the average daily temperatures in New York City over the course of one year. We would expect to find the lowest temperatures in January and February and highest in July and August. This familiar cycle repeats year after year, and if we were to extend the graph over multiple years, it would resemble a periodic function.

Many other natural phenomena are also periodic. For example, the phases of the moon have a period of approximately 28 days, and birds know to fly south at about the same time each year.

So how can we model an equation to reflect periodic behavior? First, we must collect and record data. We then find a function that resembles an observed pattern. Finally, we make the necessary alterations to the function to get a model that is dependable. In this section, we will take a deeper look at specific types of periodic behavior and model equations to fit data.

Determining the amplitude and period of a sinusoidal function

Any motion that repeats itself in a fixed time period is considered periodic motion and can be modeled by a sinusoidal function    . The amplitude    of a sinusoidal function is the distance from the midline to the maximum value, or from the midline to the minimum value. The midline    is the average value. Sinusoidal functions oscillate above and below the midline, are periodic, and repeat values in set cycles. Recall from Graphs of the Sine and Cosine Functions that the period    of the sine function and the cosine function is   2 π .   In other words, for any value of   x ,

sin ( x ± 2 π k ) = sin x     and     cos ( x ± 2 π k ) = cos x     where  k  is an integer

Standard form of sinusoidal equations

The general forms of a sinusoidal equation are given as

y = A sin ( B t C ) + D  or  y = A cos ( B t C ) + D

where amplitude = | A | , B is related to period such that the  period = 2 π B , C   is the phase shift such that   C B   denotes the horizontal shift, and   D   represents the vertical shift from the graph’s parent graph.

Note that the models are sometimes written as   y = a sin ( ω t ± C ) + D   or   y = a cos ( ω t ± C ) + D , and period is given as   2 π ω .

The difference between the sine and the cosine graphs is that the sine graph begins with the average value of the function and the cosine graph begins with the maximum or minimum value of the function.

Showing how the properties of a trigonometric function can transform a graph

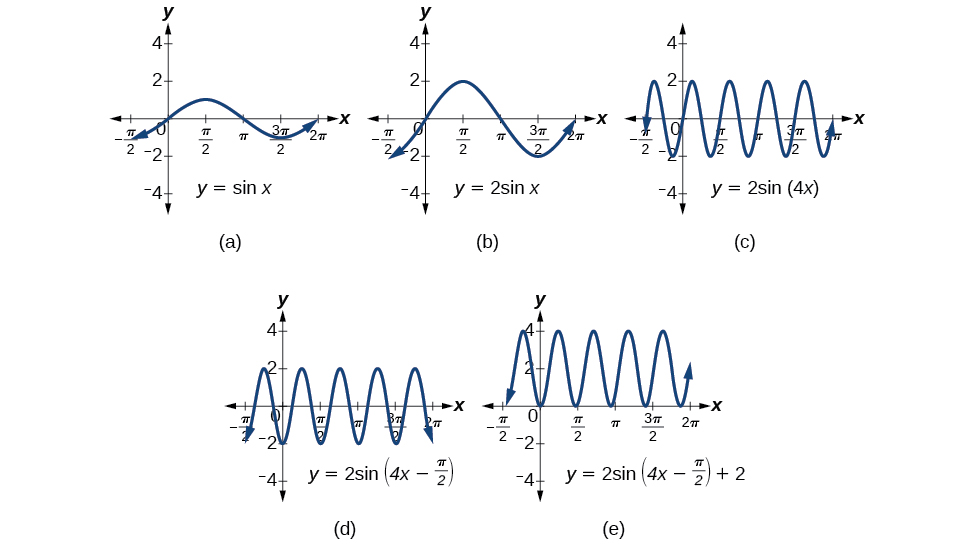
Show the transformation of the graph of   y = sin x   into the graph of   y = 2 sin ( 4 x π 2 ) + 2.

Consider the series of graphs in [link] and the way each change to the equation changes the image.

Five graphs, side by side, each showing a manipulation to the former. (A) has y=sin(x). (B) has y=2sin(x), which has double the amplitude. (C) has y=2sin(4x), which quadrupled the frequency (or quartered the period). (D) has y=2sin(4x-pi/2), which shifted it on the x-axis by pi/2. (E) has y=2sin(4x-pi/2) + 2, which shifted it on the y-axis by 2.
(a) The basic graph of   y = sin x   (b) Changing the amplitude from 1 to 2 generates the graph of   y = 2 sin x .   (c) The period of the sine function changes with the value of   B , such that  period = 2 π B . Here we have   B = 4 , which translates to a period of   π 2 . The graph completes one full cycle in   π 2   units. (d) The graph displays a horizontal shift equal to   C B , or   π 2 4 = π 8 . (e) Finally, the graph is shifted vertically by the value of   D . In this case, the graph is shifted up by 2 units.
Got questions? Get instant answers now!

Questions & Answers

calculate molarity of NaOH solution when 25.0ml of NaOH titrated with 27.2ml of 0.2m H2SO4
Gasin Reply
what's Thermochemistry
rhoda Reply
the study of the heat energy which is associated with chemical reactions
Kaddija
How was CH4 and o2 was able to produce (Co2)and (H2o
Edafe Reply
explain please
Victory
First twenty elements with their valences
Martine Reply
what is chemistry
asue Reply
what is atom
asue
what is the best way to define periodic table for jamb
Damilola Reply
what is the change of matter from one state to another
Elijah Reply
what is isolation of organic compounds
IKyernum Reply
what is atomic radius
ThankGod Reply
Read Chapter 6, section 5
Dr
Read Chapter 6, section 5
Kareem
Atomic radius is the radius of the atom and is also called the orbital radius
Kareem
atomic radius is the distance between the nucleus of an atom and its valence shell
Amos
Read Chapter 6, section 5
paulino
Bohr's model of the theory atom
Ayom Reply
is there a question?
Dr
when a gas is compressed why it becomes hot?
ATOMIC
It has no oxygen then
Goldyei
read the chapter on thermochemistry...the sections on "PV" work and the First Law of Thermodynamics should help..
Dr
Which element react with water
Mukthar Reply
Mgo
Ibeh
an increase in the pressure of a gas results in the decrease of its
Valentina Reply
definition of the periodic table
Cosmos Reply
What is the lkenes
Da Reply
what were atoms composed of?
Moses Reply
Got questions? Join the online conversation and get instant answers!
Jobilize.com Reply
Practice Key Terms 2

Get Jobilize Job Search Mobile App in your pocket Now!

Get it on Google Play Download on the App Store Now


Source:  OpenStax, Precalculus. OpenStax CNX. Jan 19, 2016 Download for free at https://legacy.cnx.org/content/col11667/1.6
Google Play and the Google Play logo are trademarks of Google Inc.

Notification Switch

Would you like to follow the 'Precalculus' conversation and receive update notifications?

Ask