<< Chapter < Page Chapter >> Page >
In this section, you will:
  • Graph variations of  y=sin( x )  and  y=cos( x ).
  • Use phase shifts of sine and cosine curves.
A photo of a rainbow colored beam of light stretching across the floor.
Light can be separated into colors because of its wavelike properties. (credit: "wonderferret"/ Flickr)

White light, such as the light from the sun, is not actually white at all. Instead, it is a composition of all the colors of the rainbow in the form of waves. The individual colors can be seen only when white light passes through an optical prism that separates the waves according to their wavelengths to form a rainbow.

Light waves can be represented graphically by the sine function. In the chapter on Trigonometric Functions , we examined trigonometric functions such as the sine function. In this section, we will interpret and create graphs of sine and cosine functions.

Graphing sine and cosine functions

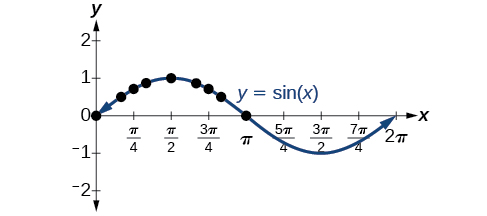
Recall that the sine and cosine functions relate real number values to the x - and y -coordinates of a point on the unit circle. So what do they look like on a graph on a coordinate plane? Let’s start with the sine function    . We can create a table of values and use them to sketch a graph. [link] lists some of the values for the sine function on a unit circle.

x 0 π 6 π 4 π 3 π 2 2 π 3 3 π 4 5 π 6 π
sin ( x ) 0 1 2 2 2 3 2 1 3 2 2 2 1 2 0

Plotting the points from the table and continuing along the x -axis gives the shape of the sine function. See [link] .

A graph of sin(x). Local maximum at (pi/2, 1). Local minimum at (3pi/2, -1). Period of 2pi.
The sine function

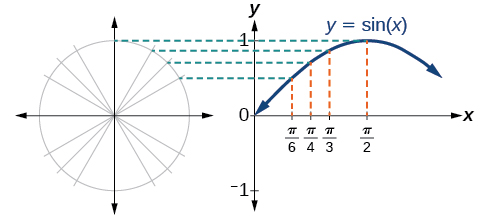
Notice how the sine values are positive between 0 and π , which correspond to the values of the sine function in quadrants I and II on the unit circle, and the sine values are negative between π and 2 π , which correspond to the values of the sine function in quadrants III and IV on the unit circle. See [link] .

A side-by-side graph of a unit circle and a graph of sin(x). The two graphs show the equivalence of the coordinates.
Plotting values of the sine function

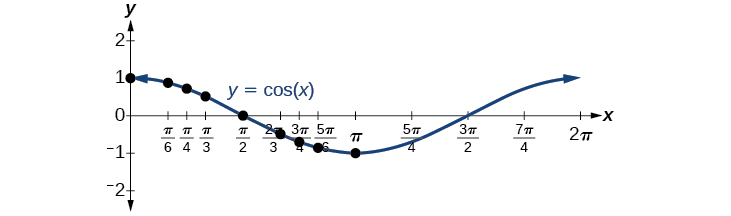
Now let’s take a similar look at the cosine function    . Again, we can create a table of values and use them to sketch a graph. [link] lists some of the values for the cosine function on a unit circle.

x 0 π 6 π 4 π 3 π 2 2 π 3 3 π 4 5 π 6 π
cos ( x ) 1 3 2 2 2 1 2 0 1 2 2 2 3 2 1

As with the sine function, we can plots points to create a graph of the cosine function as in [link] .

A graph of cos(x). Local maxima at (0,1) and (2pi, 1). Local minimum at (pi, -1). Period of 2pi.
The cosine function

Because we can evaluate the sine and cosine of any real number, both of these functions are defined for all real numbers. By thinking of the sine and cosine values as coordinates of points on a unit circle, it becomes clear that the range of both functions must be the interval [ 1 , 1 ] .

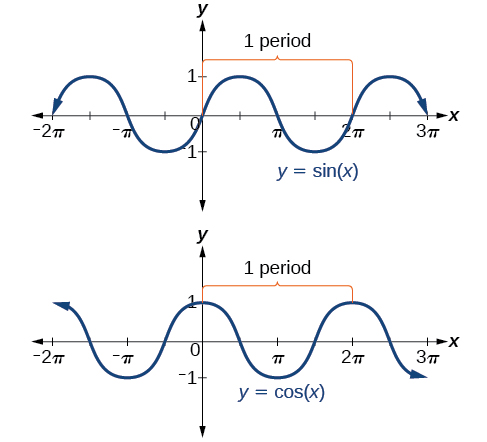
In both graphs, the shape of the graph repeats after 2 π , which means the functions are periodic with a period of 2 π . A periodic function    is a function for which a specific horizontal shift    , P , results in a function equal to the original function: f ( x + P ) = f ( x ) for all values of x in the domain of f . When this occurs, we call the smallest such horizontal shift with P > 0 the period    of the function. [link] shows several periods of the sine and cosine functions.

Side-by-side graphs of sin(x) and cos(x). Graphs show period lengths for both functions, which is 2pi.

Looking again at the sine and cosine functions on a domain centered at the y -axis helps reveal symmetries. As we can see in [link] , the sine function    is symmetric about the origin. Recall from The Other Trigonometric Functions that we determined from the unit circle that the sine function is an odd function because sin ( x ) = sin x . Now we can clearly see this property from the graph.

Questions & Answers

what does mean opportunity cost?
Aster Reply
what is poetive effect of population growth
Solomon Reply
what is inflation
Nasir Reply
what is demand
Eleni
what is economics
IMLAN Reply
economics theory describes individual behavior as the result of a process of optimization under constraints the objective to be reached being determined by
Kalkidan
Economics is a branch of social science that deal with How to wise use of resource ,s
Kassie
need
WARKISA
Economic Needs: In economics, needs are goods or services that are necessary for maintaining a certain standard of living. This includes things like healthcare, education, and transportation.
Kalkidan
What is demand and supply
EMPEROR Reply
deman means?
Alex
what is supply?
Alex
ex play supply?
Alex
Money market is a branch or segment of financial market where short-term debt instruments are traded upon. The instruments in this market includes Treasury bills, Bonds, Commercial Papers, Call money among other.
murana Reply
good
Kayode
what is money market
umar Reply
Examine the distinction between theory of comparative cost Advantage and theory of factor proportion
Fatima Reply
What is inflation
Bright Reply
a general and ongoing rise in the level of prices in an economy
AI-Robot
What are the factors that affect demand for a commodity
Florence Reply
price
Kenu
differentiate between demand and supply giving examples
Lambiv Reply
differentiated between demand and supply using examples
Lambiv
what is labour ?
Lambiv
how will I do?
Venny Reply
how is the graph works?I don't fully understand
Rezat Reply
information
Eliyee
devaluation
Eliyee
t
WARKISA
hi guys good evening to all
Lambiv
multiple choice question
Aster Reply
appreciation
Eliyee
explain perfect market
Lindiwe Reply
In economics, a perfect market refers to a theoretical construct where all participants have perfect information, goods are homogenous, there are no barriers to entry or exit, and prices are determined solely by supply and demand. It's an idealized model used for analysis,
Ezea
Got questions? Join the online conversation and get instant answers!
Jobilize.com Reply
Practice Key Terms 5

Get Jobilize Job Search Mobile App in your pocket Now!

Get it on Google Play Download on the App Store Now


Source:  OpenStax, Precalculus. OpenStax CNX. Jan 19, 2016 Download for free at https://legacy.cnx.org/content/col11667/1.6
Google Play and the Google Play logo are trademarks of Google Inc.

Notification Switch

Would you like to follow the 'Precalculus' conversation and receive update notifications?

Ask