

| << Chapter < Page | Chapter >> Page > |
[link] shows commonly used stationary phase in various applications.
| Stationary phase | Common trade name | Maximum temperature (°C) | Common applications |
| Polydimethyl siloxane | OV-1, SE-30 | 350 | General-purpose nonpolar phase, hydrocarbons, polynuclear aromatics, drugs, steroids, PCBs |
| Poly(phenylmethyl-dimethyl) siloxane (10% phenyl) | OV-3, SE-52 | 350 | Fatty acid methyl esters, alkaloids, drugs, halogenated compounds |
| Poly(phenylmethyl) siloxane (50% phenyl) | OV-17 | 250 | Drugs, steroids, pesticides, glycols |
| Poly(trifluoropropyl-dimethyl) siloxane | OV-210 | 200 | Chlorinated aromatics, nitroaromatics, alkyl-substituted benzenes |
| Polyethylene glycol | Carbowax 20M | 250 | Free acids, alcohols, ethers, essential oils, glycols |
| Poly(dicyanoallyldimethyl) siloxane | OV-275 | 240 | Polyunsaturated fatty acid, rosin acids, free acids, alcohols |
For precise work, the column temperature must be controlled to within tenths of a degree. The optimum column temperature is dependent upon the boiling point of the sample. As a rule of thumb, a temperature slightly above the average boiling point of the sample results in an elution time of 2 - 30 minutes. Minimal temperatures give good resolution, but increase elution times. If a sample has a wide boiling range, then temperature programming can be useful. The column temperature is increased (either continuously or in steps) as separation proceeds. Another effect that temperature may have is on the shape of peak as flow rate does. The higher the temperature is, the more intensive the diffusion is, the worse the shape is. Thus, a compromise has to be made between goodness of separation and retention time as well as peak shape.
A number of detectors are used in gas chromatography. The most common are the flame ionization detector (FID) and the thermal conductivity detector (TCD). Both are sensitive to a wide range of components, and both work over a wide range of concentrations. While TCDs are essentially universal and can be used to detect any component other than the carrier gas (as long as their thermal conductivities are different from that of the carrier gas, at detector temperature), FIDs are sensitive primarily to hydrocarbons, and are more sensitive to them than TCD. However, an FID cannot detect water. Both detectors are also quite robust. Since TCD is non-destructive, it can be operated in-series before an FID (destructive), thus providing complementary detection of the same analytes.For halides, nitrates, nitriles, peroxides, anhydrides and organometallics, ECD is a very sensitive detection, which can detect up to 50 fg of those analytes. Different types of detectors are listed below in [link] , along with their properties.
| Detector | Type | Support gases | Selectivity | Detectability | Dynamic range |
| Flame ionization (FID) | Mass flow | Mass flow | Most organic compounds | 100 pg | 10 7 |
| Thermal conductivity (TCD) | Concentration | Reference | Universal | 1 ng | 10 7 |
| Electron capture (ECD) | Concentration | Make-up | Halides, nitrates, nitriles, peroxides, anhydrides, organometallics | 50 fg | 10 5 |
| Nitrogen-phosphorus | Mass flow | Hydrogen and air | Nitrogen, phosphorus | 10 pg | 10 6 |
| Flame photometric (FPD) | Mass flow | Hydrogen and air possibly oxygen | Sulphur, phosphorus, tin, boron, arsenic, germanium, selenium, chromium | 100 pg | 10 3 |
| Photo-ionization (PID) | Concentration | Make-up | Aliphatics, aromatics, ketones, esters, aldehydes, amines, heterocyclics, organosulphurs, some organometallics | 2 pg | 10 7 |
| Hall electrolytic conductivity | Mass flow | Hydrogen, oxygen | Halide, nitrogen, nitrosamine, sulphur | - | - |
Most consumer products and biological samples are composed of a wide variety of compounds that differ in molecular weight, polarity, and volatility. For complex samples like these, headspace sampling is the fastest and cleanest method for analyzing volatile organic compounds. A headspace sample is normally prepared in a vial containing the sample, the dilution solvent, a matrix modifier, and the headspace ( [link] ). Volatile components from complex sample mixtures can be extracted from non-volatile sample components and isolated in the headspace or vapor portion of a sample vial. An aliquot of the vapor in the headspace is delivered to a GC system for separation of all of the volatile components.
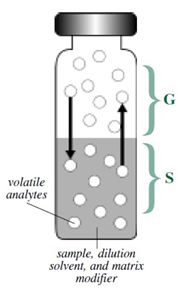
The gas phase (G in [link] ) is commonly referred to as the headspace and lies above the condensed sample phase. The sample phase (S in [link] ) contains the compound(s) of interest and is usually in the form of a liquid or solid in combination with a dilution solvent or a matrix modifier. Once the sample phase is introduced into the vial and the vial is sealed, volatile components diffuse into the gas phase until the headspace has reached a state of equilibrium as depicted by the arrows. The sample is then taken from the headspace.
Samples must be prepared to maximize the concentration of the volatile components in the headspace, and minimize unwanted contamination from other compounds in the sample matrix. To help determine the concentration of an analyte in the headspace, you will need to calculate the partition coefficient (K), which is defined by [link] , where C s is the concentration of analyte in sample phase and C g is the concentration of analyte in gas phase. Compounds that have low K values will tend to partition more readily into the gas phase, and have relatively high responses and low limits of detection. K can be lowered by changing the temperature at which the vial is equilibrated or by changing the composition of the sample matrix.
The phase ratio (β) is defined as the relative volume of the headspace compared to volume of the sample in the sample vial, [link] , where V s =volume of sample phase and V g =volume of gas phase. Lower values for β (i.e., larger sample size) will yield higher responses for volatile compounds. However, decreasing the β value will not always yield the increase in response needed to improve sensitivity. When β is decreased by increasing the sample size, compounds with high K values partition less into the headspace compared to compounds with low K values, and yield correspondingly smaller changes in C g . Samples that contain compounds with high K values need to be optimized to provide the lowest K value before changes are made in the phase ratio.
Notification Switch
Would you like to follow the 'Physical methods in chemistry and nano science' conversation and receive update notifications?

|
|

|
|

|
|

|
|

|
|

|
|

|
|

|
|

|
|

|