<< Chapter < Page Chapter >> Page >
SEM image of a representative crystal used for WDS and X-ray diffraction analysis showing the location and results for the WDS analysis. The 10 μm sized analysis spots are represented by the white dots. Adapted from B. D. Fahlman, Ph.D. Thesis, Rice University, 2000.

Comparison of the methods

Method 1

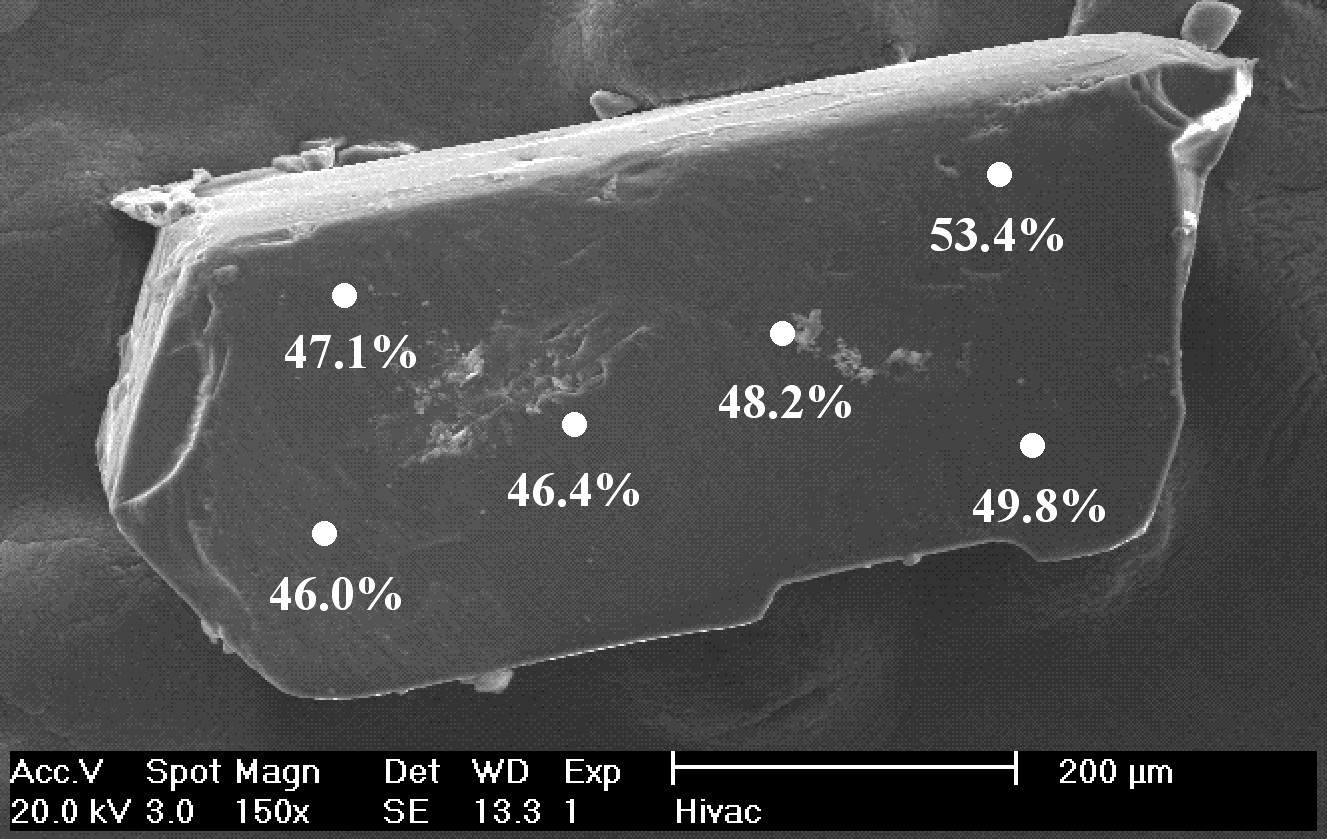
Since Method 1 does not refine the %Cr and relies on an input for the Al and Cr percent composition of the "bulk" material, i.e., the %Cr in the total mass of the material ( [link] , Column 1), as opposed to the analysis of the single crystal on which X-ray diffraction was performed, ( [link] , Column 2), the closer these values were to the "actual" value determined by WDS for the crystal on which X-ray diffraction was performed ( [link] , Column 1 versus 2) then the closer the overall refinement of the structure to those of Methods 2 - 4.

While this assumption is obviously invalid for many of the samples, it is one often used when bulk data (for example, from NMR) is available. However, as there is no reason to assume that one crystal is completely representative of the bulk sample, it is unwise to rely only on such data.

Method 2

This method always produced final, refined, occupancy values that were close to those obtained from WDS ( [link] ). This approach assumes that the motion of the central metal atoms is identical. While this is obviously not strictly true as they are of different size, the results obtained herein imply that this is a reasonable approximation where simple connectivity data is required. For samples where the amount of one of the elements (i.e., Cr) is very low so low a good refinement can not often be obtained. In theses cases, when refining the occupancy values, that for Al would exceed 1 while that of Cr would be less than 1!

Method 3

In some cases, despite the interrelationship between the occupancy and the displacement parameters, convergence was obtained successfully. In these cases the refined occupancies were both slightly closer to those observed from WDS than the occupancy values obtained using Method 2. However, for some samples with higher Cr content the refinement was unstable and would not converge. Whether this observation was due to the increased percentage of Cr or simply lower data quality is not certain.

While this method does allow refinement of any differences in atomic motion between the two metals, it requires extremely high quality data for this difference to be determined reliably.

Method 4

This approach adds little to the final results.

Correlation between analyzed composition and refined composition

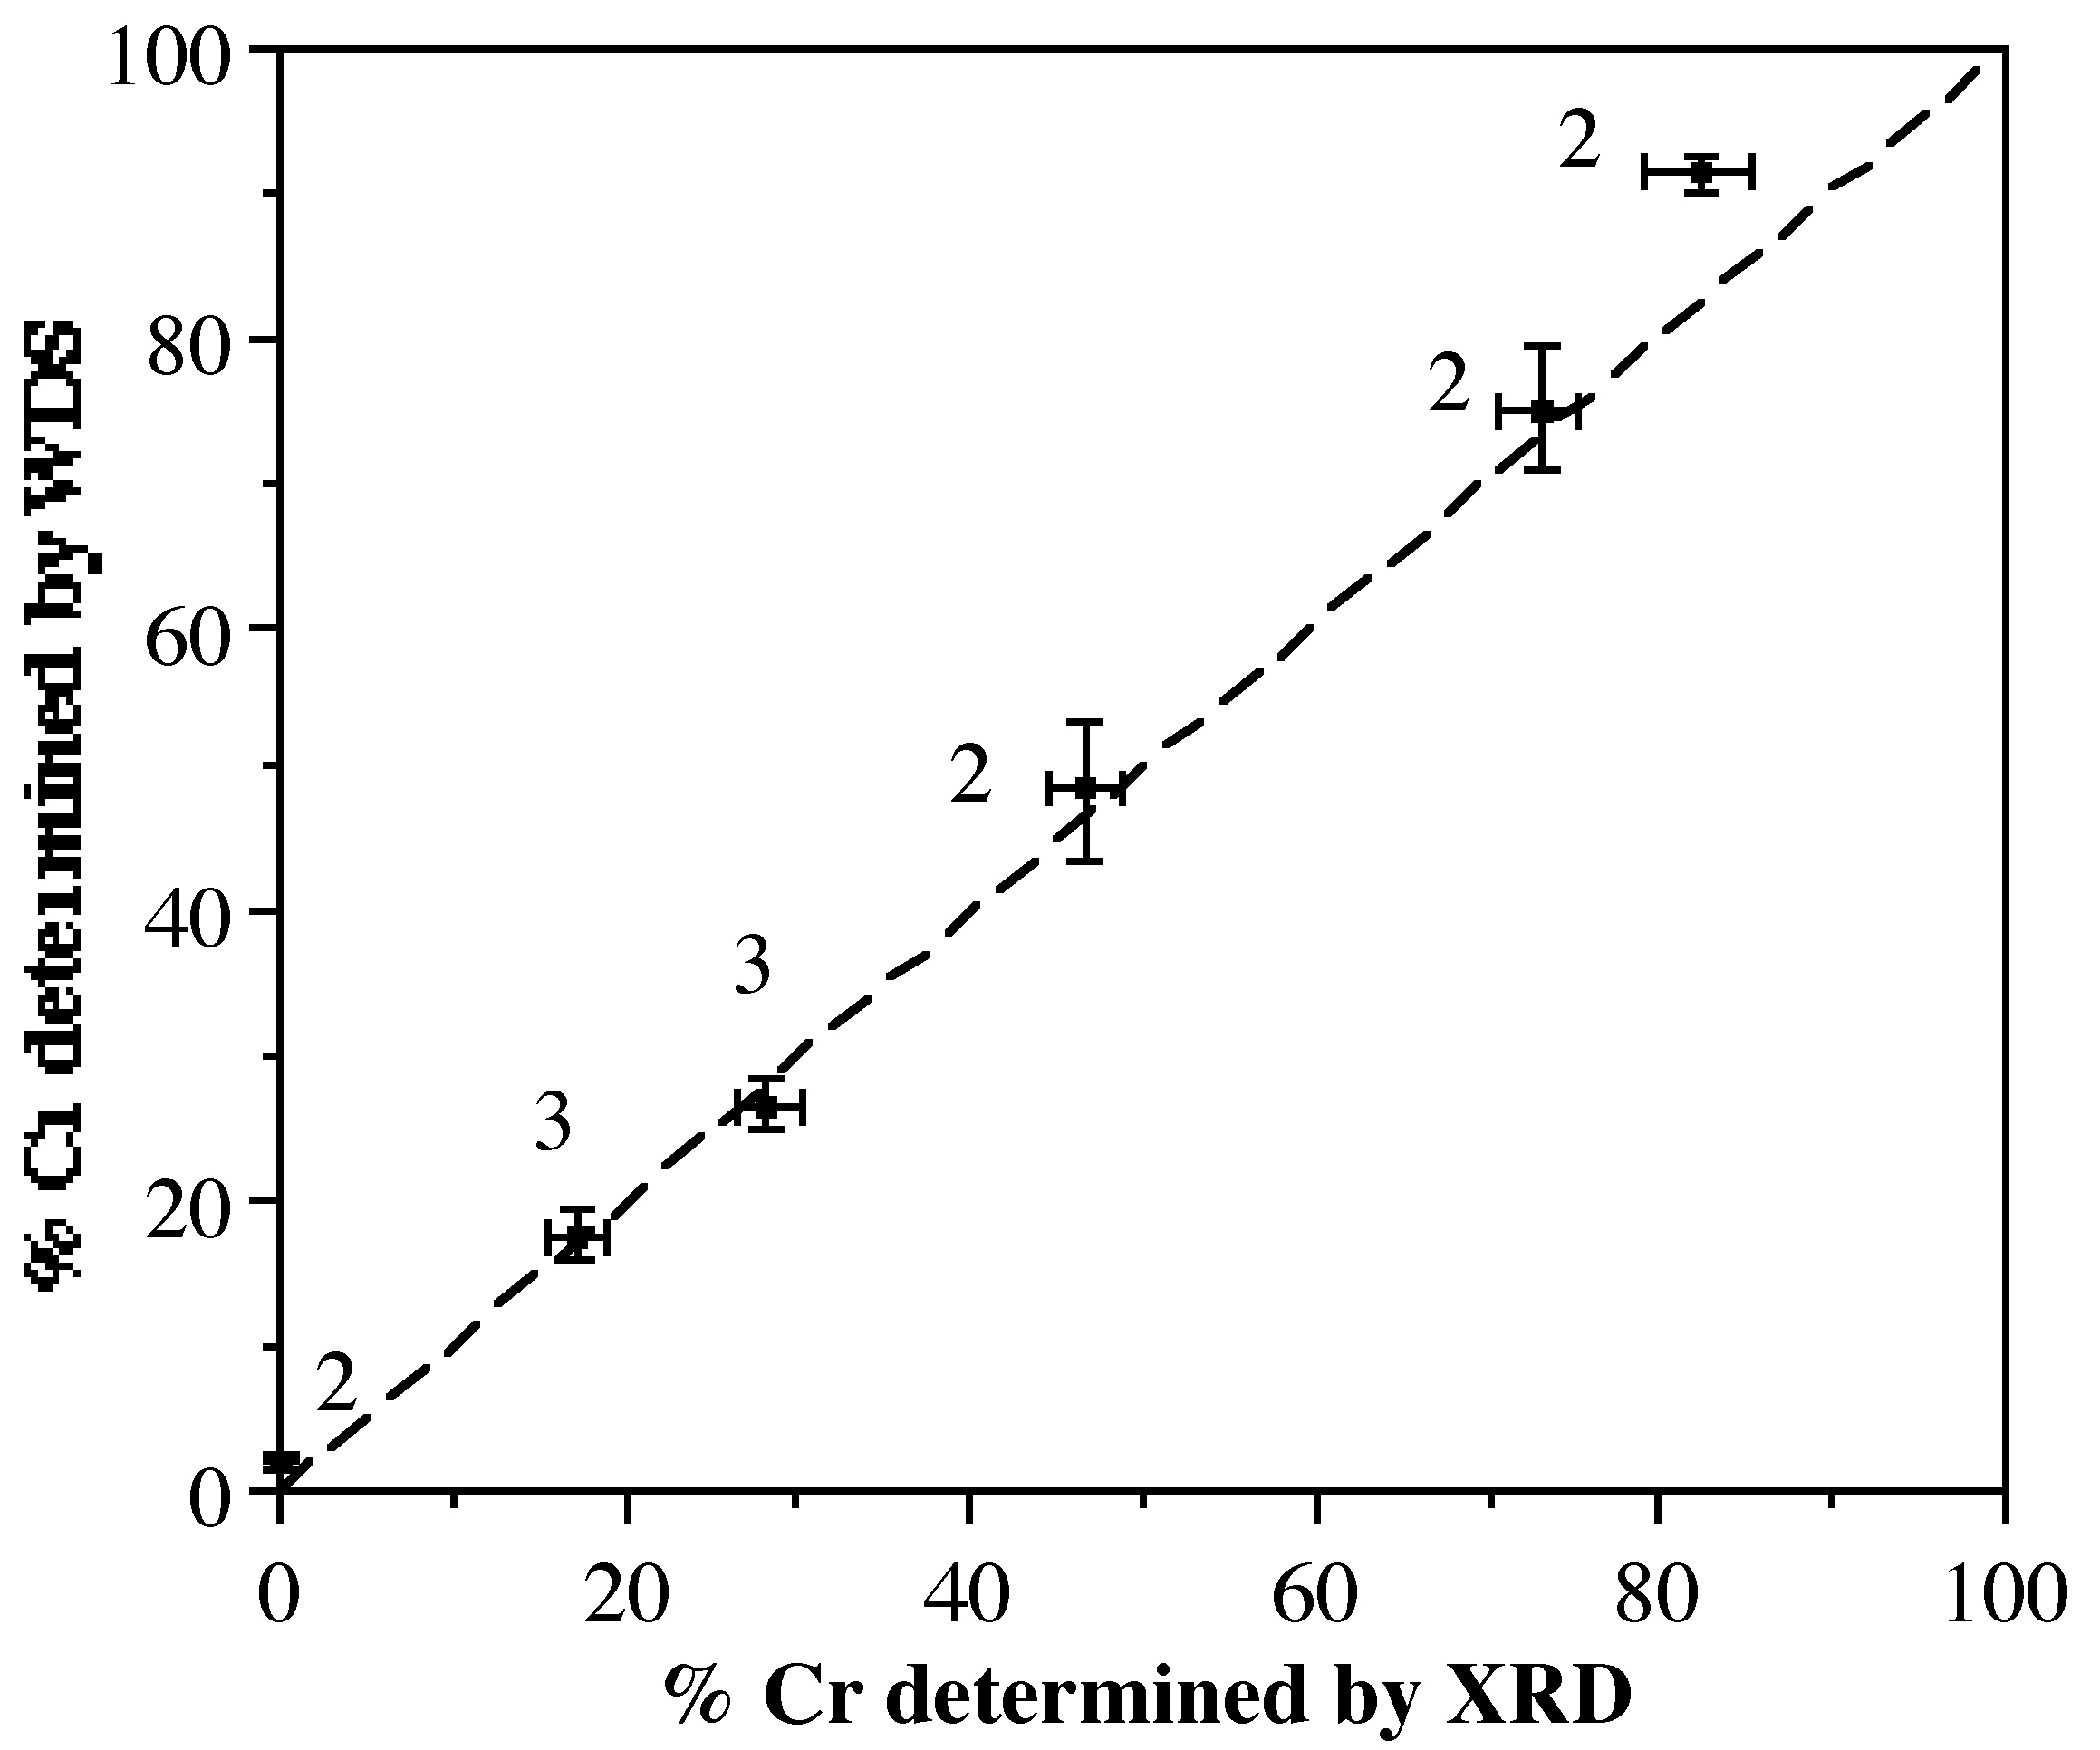
[link] shows the relationship between the chromium concentration (%Cr) determined from WDS and the refinement of X-ray diffraction data using Methods 2 or 3 (labeled in [link] ). Clearly there exists a good correlation, with only a slight divergence at high Cr concentration. This is undoubtedly a consequence of trying to refine a low fraction of a light atom (Al) in the presence of a large fraction of a heavier atom (Cr). X-ray diffraction is, therefore, an accurate method of determining the M:M' ratios in crystalline solid solution.

Comparison of the chromium concentration determined from WDS (with error) and refinement of X-ray diffraction data (with error) using Methods 2 or 3. Adapted from S. G. Bott, B. D. Fahlman, M. L. Pierson, and A. R. Barron, J. Chem. Soc., Dalton Trans. , 2001, 2148.

Bibliography

  • S. G. Bott, B. D. Fahlman, M. L. Pierson, and A. R. Barron, J. Chem. Soc., Dalton Trans. , 2001, 2148.
  • K. R. Dunbar and S. C. Haefner, Inorg. Chem., 1992, 31 , 3676.
  • J. Glusker, M. Lewis, and M., Rossi, Crystal Structure Analysis for Chemists and Biologists VCH: New York (1994).
  • K. Yoon and G. Parkin, Inorg. Chem. , 1992, 114 , 31.

Questions & Answers

how do you get the 2/50
Abba Reply
number of sport play by 50 student construct discrete data
Aminu Reply
width of the frangebany leaves on how to write a introduction
Theresa Reply
Solve the mean of variance
Veronica Reply
Step 1: Find the mean. To find the mean, add up all the scores, then divide them by the number of scores. ... Step 2: Find each score's deviation from the mean. ... Step 3: Square each deviation from the mean. ... Step 4: Find the sum of squares. ... Step 5: Divide the sum of squares by n – 1 or N.
kenneth
what is error
Yakuba Reply
Is mistake done to something
Vutshila
Hy
anas
hy
What is the life teble
anas
hy
Jibrin
statistics is the analyzing of data
Tajudeen Reply
what is statics?
Zelalem Reply
how do you calculate mean
Gloria Reply
diveving the sum if all values
Shaynaynay
let A1,A2 and A3 events be independent,show that (A1)^c, (A2)^c and (A3)^c are independent?
Fisaye Reply
what is statistics
Akhisani Reply
data collected all over the world
Shaynaynay
construct a less than and more than table
Imad Reply
The sample of 16 students is taken. The average age in the sample was 22 years with astandard deviation of 6 years. Construct a 95% confidence interval for the age of the population.
Aschalew Reply
Bhartdarshan' is an internet-based travel agency wherein customer can see videos of the cities they plant to visit. The number of hits daily is a normally distributed random variable with a mean of 10,000 and a standard deviation of 2,400 a. what is the probability of getting more than 12,000 hits? b. what is the probability of getting fewer than 9,000 hits?
Akshay Reply
Bhartdarshan'is an internet-based travel agency wherein customer can see videos of the cities they plan to visit. The number of hits daily is a normally distributed random variable with a mean of 10,000 and a standard deviation of 2,400. a. What is the probability of getting more than 12,000 hits
Akshay
1
Bright
Sorry i want to learn more about this question
Bright
Someone help
Bright
a= 0.20233 b=0.3384
Sufiyan
a
Shaynaynay
How do I interpret level of significance?
Mohd Reply
It depends on your business problem or in Machine Learning you could use ROC- AUC cruve to decide the threshold value
Shivam
how skewness and kurtosis are used in statistics
Owen Reply
yes what is it
Taneeya
Got questions? Join the online conversation and get instant answers!
Jobilize.com Reply

Get Jobilize Job Search Mobile App in your pocket Now!

Get it on Google Play Download on the App Store Now


Source:  OpenStax, Physical methods in chemistry and nano science. OpenStax CNX. May 05, 2015 Download for free at http://legacy.cnx.org/content/col10699/1.21
Google Play and the Google Play logo are trademarks of Google Inc.

Notification Switch

Would you like to follow the 'Physical methods in chemistry and nano science' conversation and receive update notifications?

Ask