

| << Chapter < Page | Chapter >> Page > |
LC-MS is a common detection approach in the field of food safety. But because of the complex matrix of the samples, it is always difficult to detect those target molecules of low concentration by using single quadrupole MS. The following gives an example of the application of LC/ESI-QTOF-MS.
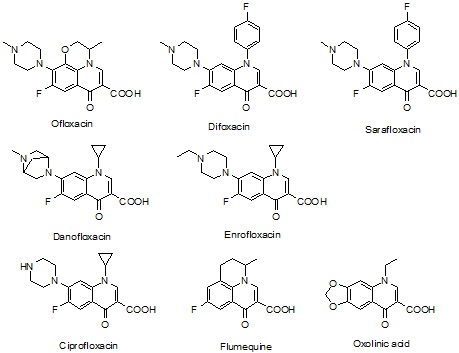
Using a quaternary pump system, a Q-TOF-MS system, a C18 column (250 mm × 2.0 mm I.D., 5 µm) with a flow rate of 0.2 mL/min, and a mixture of solvents as the mobile phase comprising of 0.3% formic acid solution and acetonitrile. The gradient phofile for mobile phase is shown in [link] . Since at acidic pH condition, the quinolones carried a positive charge, all mass spectra were acquired in the positive ion mode and summarizing 30,000 single spectra in the mass range of 100-500 Da.
| Time (min) | Volume % of formic acid solution | Volume % of acetonitrile |
| 0 | 80 | 20 |
| 12 | 65 | 35 |
| 15 | 20 | 80 |
| 20 | 15 | 85 |
| 30 | 15 | 85 |
| 30.01 | 80 | 20 |
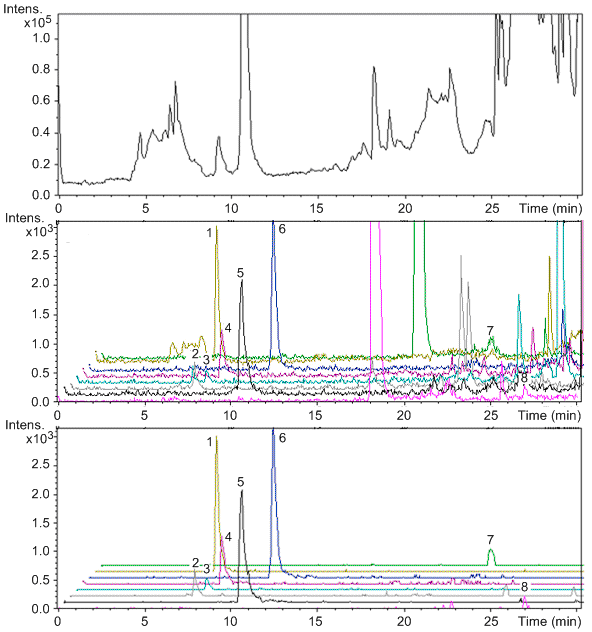
The optimal ionization source working parameters were as follows: capillary voltage 4.5 kV; ion energy of quadrupole 5 eV/z; dry temperature 200 °C; nebulizer 1.2 bar; dry gas 6.0 L/min. During the experiments, HCO 2 Na (62 Da) was used to externally calibrate the instrument. Because of the high mass accuracy of the TOF mass spectrometer, it can extremely reduce the matrix effects. Three different chromatographs are shown in [link] . The top one is the total ion chromatograph at the window range of 400 Da. It’s impossible to distinguish the target molecules in this chromatograph. The middle one is at one Da resolution, which is the resolution of single quadrupole mass spectrometer. In this chromatograph, some of the molecules can be identified. But noise intensity is still very high and there are several peaks of impurities with similar mass-to-charge ratios in the chromatograph. The bottom one is at 0.01 Da resolution. It clearly shows the peaks of eight quinolones with very high signal to noise ratio. In other words, due to the fast acquisition rates and high mass accuracy, LC/TOF-MS can significantly reduce the matrix effects.
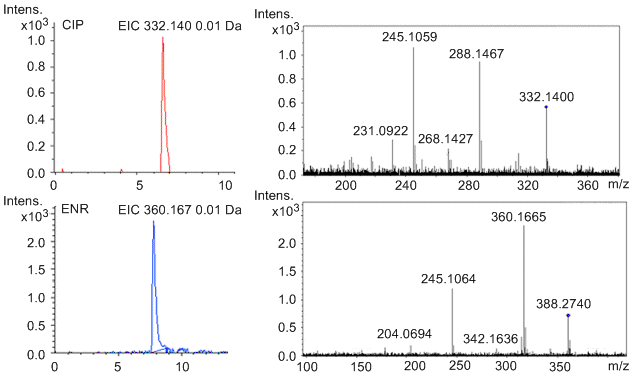
The quadrupole MS can be used to further confirm the target molecules. [link] shows the chromatograms obtained in the confirmation of CIP (17.1 ng/g) in a positive milk sample and ENR (7.5 ng/g) in a positive fish sample. The chromatographs of parent ions are shown on the left side. On the right side, they are the characteristic daughter ion mass spectra of CIP and ENR.
Some of the drawbacks of LC/Q-TOF-MS are its high costs of purchase and maintenance. It is hard to apply this method in daily detection in the area of environmental protection and food safety.
In order to reduce the matrix effect and improve the detection sensitivity, people may use some sample preparation methods, such as liquid-liquid extraction (LLE), solid-phase extraction (SPE), distillation. But these methods would consume large amount of samples, organic solvent, time and efforts. Nowadays, there appear some new sample preparation methods. For example, people may use online microdialysis, supercritical fluid extraction (SFE) and pressurized liquid extraction. In the method mentioned in the Application part, we use online in-tube solid-phase microextraction (SPME), which is an excellent sample preparation technique with the features of small sample volume, simplicity solventless extraction and easy automation.
Notification Switch
Would you like to follow the 'Physical methods in chemistry and nano science' conversation and receive update notifications?

|
|

|
|

|
|

|
|

|
|

|
|
|
|
|

|
|

|
|

|