<< Chapter < Page Chapter >> Page >
An example of a packed GC column.
An example of a capillary column.

Detectors

The purpose of a detector is to monitor the carrier gas as it emerges from the column and to generate a signal in response to variation in its composition due to eluted components. As it transmits physical signal into recordable electrical signal, it is another crucial part of GC. The requirements of a detector for GC are listed below.

Detectors for GC must respond rapidly to minute concentration of solutes as they exit the column, i.e., they are required to have a fast response and a high sensitivity. Other desirable properties of a detector are: linear response, good stability, ease of operation, and uniform response to a wide variety of chemical species or, alternatively predictable and selective response to one or more classes of solutes.

Recording devices

GC system originally used paper chart readers, but modern system typically uses an online computer, which can track and record the electrical signals of the separated peaks. The data can be later analyzed by software to provide the information of the gas mixture.

How does gc work?

Separation terminology

An ideal separation is judged by resolution, efficiency, and symmetry of the desired peaks, as illustrated by [link] .

Separation terminology. Adapted from http://www.gchelp.tk

Resolution (r)

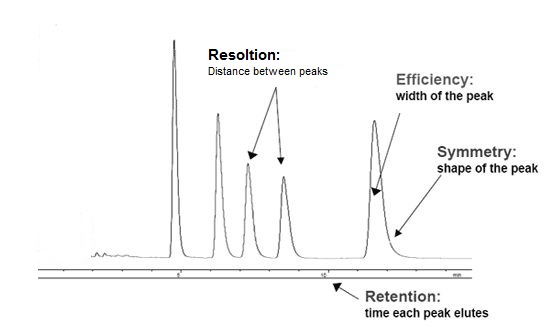
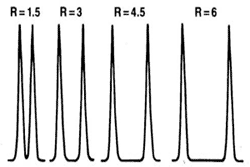
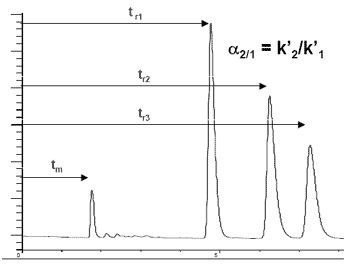
Resolution can be simply expressed as the distance on the output trace between two peaks. The highest possible resolution is the goal when developing a separation method. Resolution is defined by the R value, [link] , which can be expressed mathamatically, [link] , where k is capacity, α is selectivity, and N is the number of theoretical plates. An R value of 1.5 is defined as being the minimum required for baseline separation, i.e., the two adjacent peaks are separated by the baseline. Separation for different R values is illustrated in [link] .

Different separation resolutions. Adapted from http://www.gchelp.tk

Capacity (k´)

Capacity (k´) is known as the retention factor. It is a measure of retention by the stationary phase. It is calculated from [link] , where t r = retention time of analyte (substance to be analyzed), and t m = retention time of an unretained compound.

Selectivity

Selectivity is related to α, the separation factor ( [link] ). The value of α should be large enough to give baseline resolution, but minimized to prevent waste.

Scheme for the calculation of selectivity. Adapted from http://www.gchelp.tk

Efficiency

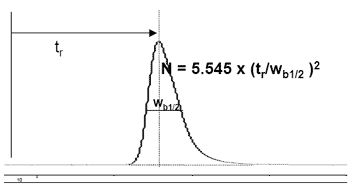
Narrow peaks have high efficiency ( [link] ), and are desired. Units of efficiency are "theoretical plates" (N) and are often used to describe column performance. "Plates" is the current common term for N, is defined as a function of the retention time (t r ) and the full peak width at half maximum (W b1/2 ), EQ.

Scheme for calculating efficiency. Adapted from http://www.gchelp.tk

Peak symmetry

The symmetry of a peak is judged by the values of two half peak widths, a and b ( [link] ). When a = b , a peak is called symmetric, which is desired. Unsymmetrical peaks are often described as "tailing" or "fronting".

Questions & Answers

how do you get the 2/50
Abba Reply
number of sport play by 50 student construct discrete data
Aminu Reply
width of the frangebany leaves on how to write a introduction
Theresa Reply
Solve the mean of variance
Veronica Reply
Step 1: Find the mean. To find the mean, add up all the scores, then divide them by the number of scores. ... Step 2: Find each score's deviation from the mean. ... Step 3: Square each deviation from the mean. ... Step 4: Find the sum of squares. ... Step 5: Divide the sum of squares by n – 1 or N.
kenneth
what is error
Yakuba Reply
Is mistake done to something
Vutshila
Hy
anas
hy
What is the life teble
anas
hy
Jibrin
statistics is the analyzing of data
Tajudeen Reply
what is statics?
Zelalem Reply
how do you calculate mean
Gloria Reply
diveving the sum if all values
Shaynaynay
let A1,A2 and A3 events be independent,show that (A1)^c, (A2)^c and (A3)^c are independent?
Fisaye Reply
what is statistics
Akhisani Reply
data collected all over the world
Shaynaynay
construct a less than and more than table
Imad Reply
The sample of 16 students is taken. The average age in the sample was 22 years with astandard deviation of 6 years. Construct a 95% confidence interval for the age of the population.
Aschalew Reply
Bhartdarshan' is an internet-based travel agency wherein customer can see videos of the cities they plant to visit. The number of hits daily is a normally distributed random variable with a mean of 10,000 and a standard deviation of 2,400 a. what is the probability of getting more than 12,000 hits? b. what is the probability of getting fewer than 9,000 hits?
Akshay Reply
Bhartdarshan'is an internet-based travel agency wherein customer can see videos of the cities they plan to visit. The number of hits daily is a normally distributed random variable with a mean of 10,000 and a standard deviation of 2,400. a. What is the probability of getting more than 12,000 hits
Akshay
1
Bright
Sorry i want to learn more about this question
Bright
Someone help
Bright
a= 0.20233 b=0.3384
Sufiyan
a
Shaynaynay
How do I interpret level of significance?
Mohd Reply
It depends on your business problem or in Machine Learning you could use ROC- AUC cruve to decide the threshold value
Shivam
how skewness and kurtosis are used in statistics
Owen Reply
yes what is it
Taneeya
Got questions? Join the online conversation and get instant answers!
Jobilize.com Reply

Get Jobilize Job Search Mobile App in your pocket Now!

Get it on Google Play Download on the App Store Now


Source:  OpenStax, Physical methods in chemistry and nano science. OpenStax CNX. May 05, 2015 Download for free at http://legacy.cnx.org/content/col10699/1.21
Google Play and the Google Play logo are trademarks of Google Inc.

Notification Switch

Would you like to follow the 'Physical methods in chemistry and nano science' conversation and receive update notifications?

Ask