

| << Chapter < Page | Chapter >> Page > |
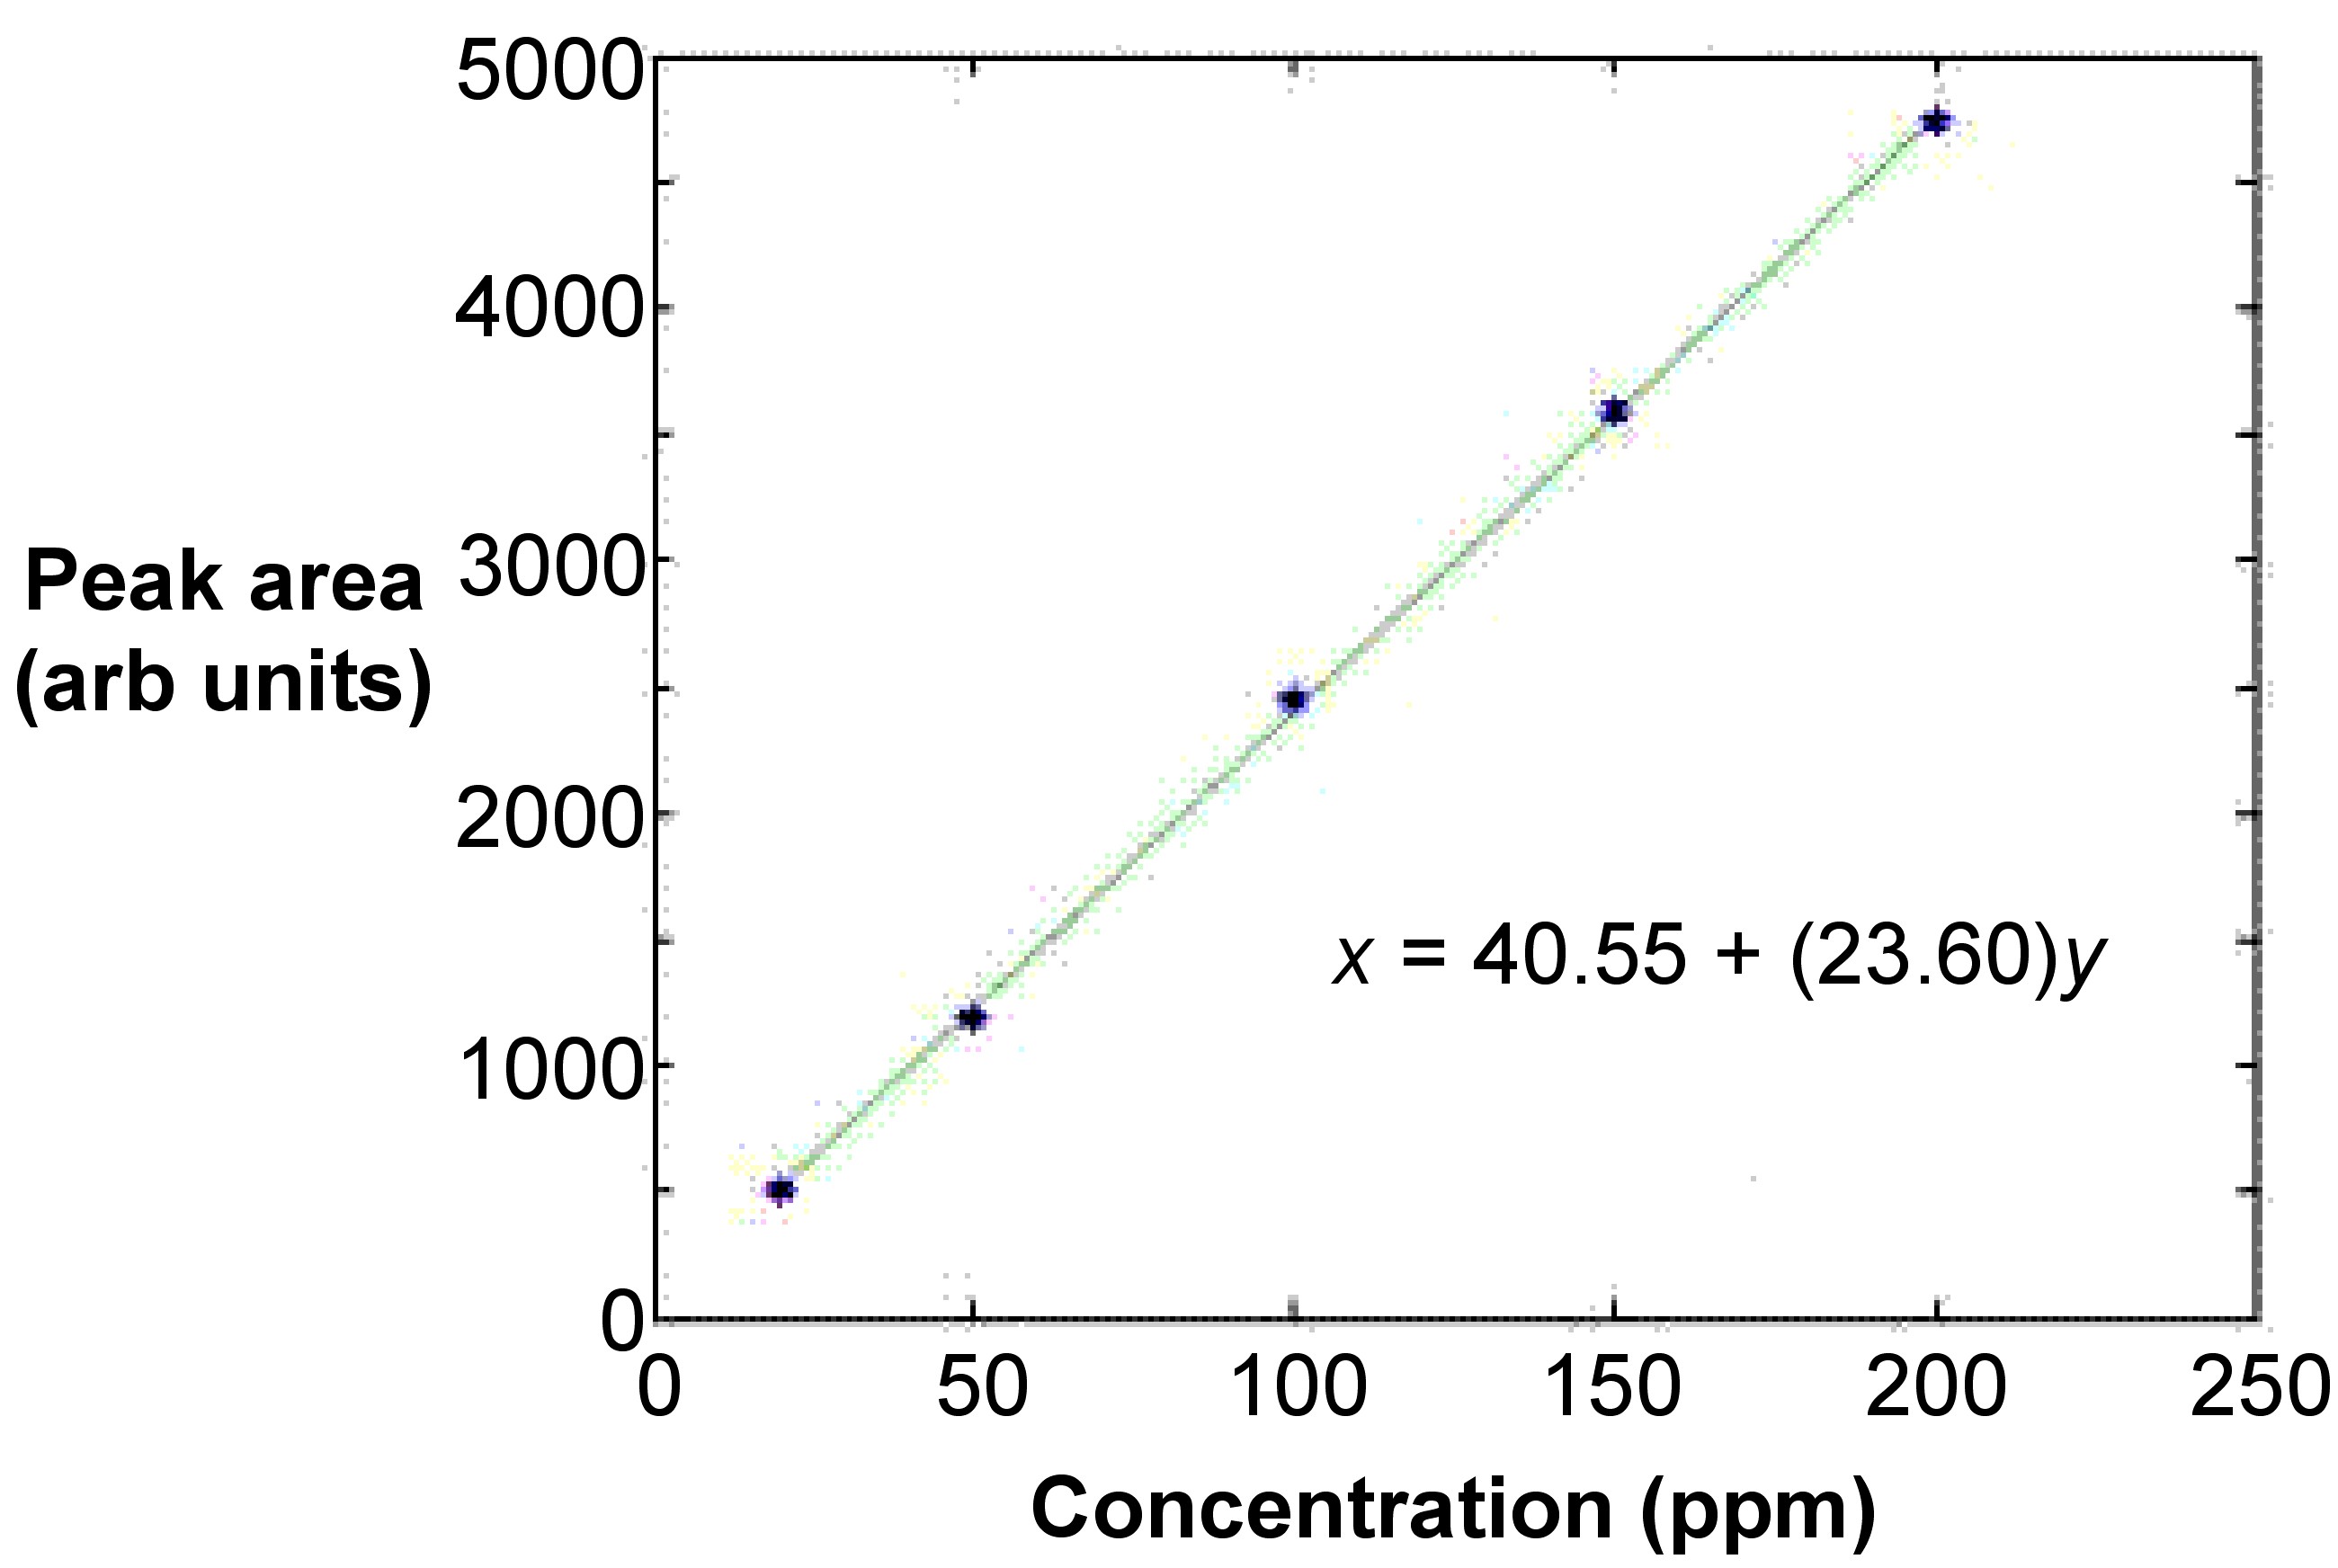
The curve is typically linear and involves at least five points from five standards that are at equidistant concentrations from each other [link] . This ensures that the fit is acceptable. A least means squares calculation is used to linearly fit the line. In most cases, the curve is linear only up to absorbance values of 0.5 to 0.8. The absorbance values of the standards should have the absorbance value of a blank subtracted.
The bracketing technique is a variation of the standard calibration technique. In this method, only two standards are necessary with concentrations c 1 and c 2 . They bracket the approximate value of the sample concentration very closely. Applying [link] to determines the value for the sample, where c x and A x are the concentration and adsorbance of the unknown, and A 1 and A 2 are the adsorbance for c 1 and c 2 , respectively.
This method is very useful when the concentration of the analyte in the sample is outside of the linear portion of the calibration curve because the bracket is so small that the portion of the curve being used can be portrayed as linear. Although this method can be used accurately for nonlinear curves, the further the curve is from linear the greater the error will be. To help reduce this error, the standards should bracket the sample very closely.
The analyte addition technique is often used when the concomitants in the sample are expected to create many interferences and the composition of the sample is unknown. The previous two techniques both require that the standards have a similar matrix to that of the sample, but that is not possible when the matrix is unknown. To compensate for this, the analyte addition technique uses an aliquot of the sample itself as the matrix. The aliquots are then spiked with various amounts of the analyte. This technique must be used only within the linear range of the absorbances.
Interference is caused by contaminants within the sample that absorb at the same wavelength as the analyte, and thus can cause inaccurate measurements. Corrections can be made through a variety of methods such as background correction, addition of chemical additives, or addition of analyte [link] .
| Interference type | Cause of interference | Result | Example | Correction measures |
| Atomic line overlap | Spectral profile of two elements are within 0.01 nm of each other | Higher experimental absorption value than the real value | Very rare, with the only plausable problem being that of copper (324.754 nm) and europium (324.753 nm) | Typically doesn't occur in practical situations, so there is no established correction method |
| Molecular band and line overlap | Spectral profile of an element overlaps with molecular band | Higher experimental absorption value than the real value | Calcium hydroxide and barium at 553.6 nm in a air-acetylene flame | Background correction |
| Ionization (vapor-phase or cation enhancement) | atoms are ionized at the temperature of the flame/furnace, which decreases the amount of free atoms | Lower experimental absorption value than real value | Problems commonly occur with cesium, potassium, and sodium | Add an ionization suppressor (or buffer) to both the sample and the standards |
| Light scattering | Solid particles scatter the beam of light lowering the intensity of the beam entering the monochromater | Higher experimental absorption value than the real value | High in samples with many refractory elements, highest at UV wavelengths (add specific example) | Matrix modifaction and/or background correction |
| Chemical | The chemical being analyzed is contained withing a compound in the analyte that is not atomized | Lower experimental absorption value than real value | Calcium and phosphate ions form calcium phosphate which is then converted to calcium pyrophosphate which is stable in high heat | Increase the temperature of the flame if flame AAS is being used, use a releasing chemical, or standard addition for electrothermal AAS |
| Physical | If physical properties of the sample and the standards are different, atomization can be affected thus affecting the number of free atom population | Can vary in either direction depending upon the conditions | Viscosity differences, surface tension differences, etc | Alter the standards to have similar physical properties to the samples |
| Volitalization | In electrothermal atomization, interference will occur if the rate of volatilization is not the same for the sample as for the standard, which is often caused by a heavy matrix | Can vary in either direction depending upon the conditions | Chlorides are very volatile, so they need to be converted to a less volatile form. Often this is done by the addition of nitrate or slufate. Zinc and lead are also highly problamatic | Change the matrix by standard addition, or selectively volatileze components of the matrix |
Notification Switch
Would you like to follow the 'Physical methods in chemistry and nano science' conversation and receive update notifications?

|
|

|
|

|
|

|
|

|
|

|
|

|
|

|
|

|
|

|